Processing error with "stripes" effect in the final result
215 views
Skip to first unread message

Sven Borgstrom
Feb 17, 2021, 1:12:42 PM2/17/21
to MintPy
Hi Yunjun,
sorry for disturbing you.
I'm processing CSK data, after the fix of the "prep_isce.py" bug. Now the script works well, MintPy processing is ok up to the end but I had an error, as you can see from the attached file.
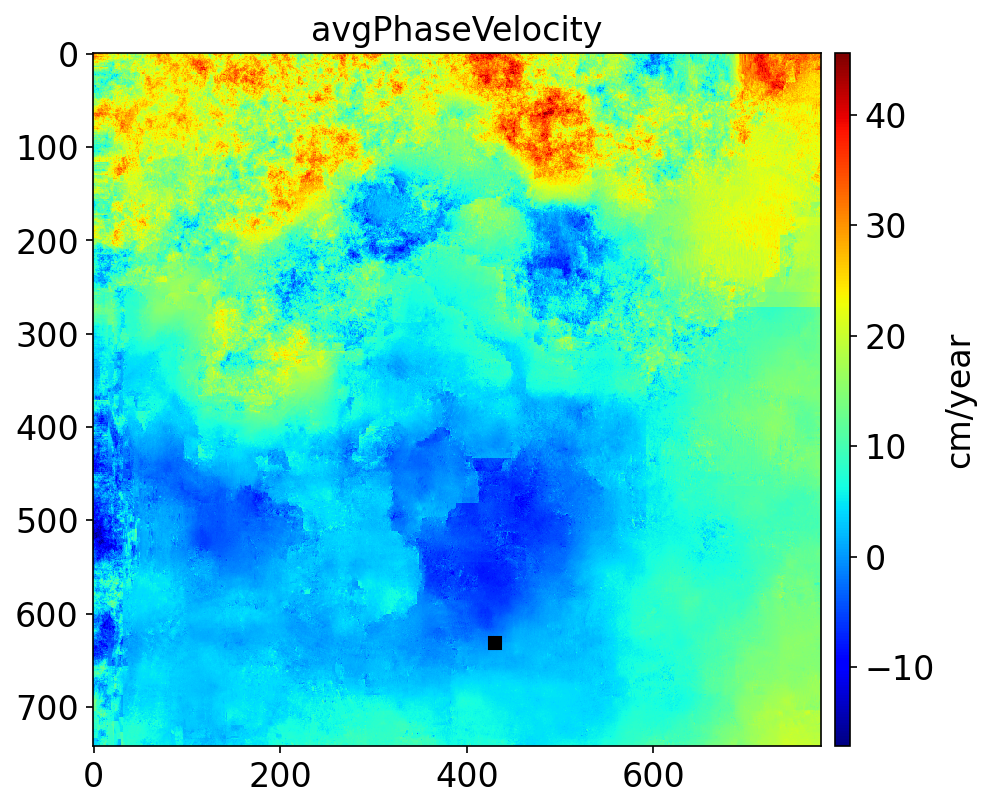
Namely, a strange "stripes" effect in the final result.
I reprocessed also and old (2019) dataset to check if something was wrong with the data, but also in this case I got the same "stripes" effect.
I suppose I was probably wrong in the "stackStripMap.py" settings or, maybe, in the processing template in the "mintpy" folder, though this is the first time I get this strange error.
How can I fix this?
Thank you in advance.
Cheers,
Sven.

Zhang Yunjun
Feb 17, 2021, 2:30:07 PM2/17/21
to MintPy
Hi Sven,
Interesting pattern. Could you show me the command of “stackStripMap.py” you used during the processing and the entire "mintpy/pic” folder for me to diagnose?
Yunjun
Yunjun
--
You received this message because you are subscribed to the Google Groups "MintPy" group.
To unsubscribe from this group and stop receiving emails from it, send an email to mintpy+un...@googlegroups.com.
To view this discussion on the web visit https://groups.google.com/d/msgid/mintpy/1d175dec-371f-431b-aa3c-e9369e48ca41n%40googlegroups.com.
<geo_velocity.png>
Sven Borgstrom
Feb 17, 2021, 3:00:33 PM2/17/21
to MintPy
Hi Yunjun,
the stackStripMap command:
stackStripMap.py -s /absolute path_to/SLC/ -x '40.77 40.90 14.00 14.33' -d /absolute_path_to/DEM/demLat*.dem.wgs84 -m referencedate -t 100 -b 250 -S 'CSK' -a 15 -r 15 -u snaphu -f 0.75 -W interferogram -z --nofocus
In the mintpy/pic folder I have 33 files: do you want me to send you all of them or just a list? Sorry I didn't understand exactly your request.
Cheers,
Sven.
Zhang Yunjun
Feb 17, 2021, 3:10:54 PM2/17/21
to MintPy
Hi Sven,
Send all of them please if you don't mind. I don't have a clue on the cause of this pattern and when it happened yet, so it will be easier to check all figures.
Yunjun
Sven Borgstrom
Feb 17, 2021, 4:02:43 PM2/17/21
to MintPy
Hi Yunjun,
figures from the pic folder attached. (first part).
I'm afraid I made a very stupid mistake b.t.w. I'm not an expert in theoretical aspects, just a simple user, so please forgive me ;)
Cheers,
Sven.
Zhang Yunjun
Feb 18, 2021, 2:08:25 PM2/18/21
to MintPy
Hi Sven,
Thank you for sending the figures. The cause of this strip is from the incorrect azimuthAngle and incidenceAngle in the geometry file, the incidenceAngle is later on used during the tropospheric correction, introducing the strips to the time-series. For now, turn off the tropospheric correction should remove this strip pattern from your final velocity.
Besides the obvious incidence/azimuth angle issue, there are some strange patterns in the spatial coherence and (un)wrapped phase as well: a shift of coherence/phase into the water. I believe all these are due to some issue(s) during the stack processing with ISCE. I will try to consult with my collages to see if we could locate the root of the cause.
Cheers,
Yunjun
Sven Borgstrom
Feb 19, 2021, 6:53:42 AM2/19/21
to MintPy
Nice! (attached file).
Regarding the second issue, given that I am not an expert in theoretical aspects, as far as I know a shift of the signal into the water occurs when dealing with short wavelengths, such as the CSK X band data, b.t.w. I am not an InSAR expert, so please correct me if I'm wrong.
Cheers,
Sven.
Zhang Yunjun
Feb 21, 2021, 7:55:42 PM2/21/21
to MintPy
Hi Sven,
After discussion with my colleague, we think the only suspicious issue is the incidence and azimuth angle, which seems to be corrupted or stopped in the middle of the processing somehow. I would recommend you to re-generate those geometry files in stripmapStack to make sure it's reproducible by 1) removing all function calls in the "configs/config_reference_*" file except for "topo" and 2) re-run "run_files/run_reference_*". Then you can plot the result using mdx.py from isce or view.py from mintpy.
I agree with you on the shift of signals on the water. It's common in the coastal area with urban infrastructures, it's called "azimuth ambiguity" for anyone who may be interested.
Cheers,
Yunjun

francesco menniti
Mar 24, 2021, 12:26:12 PM3/24/21
to MintPy
hi I'm doing the same processing but with SEntinel data.
The results I see are quite similar.
I also did an analysis with ISCE + STAMPS.
I noticed that Stamps draws points on specific objects instead Mintpy creates a dense grid of points, as if there was a smoothing.
I can kindly ask you how I can get Stamps-like results with Mintpy. Am I doing something wrong? is there a parameter or grid that I have not set correctly?
thank you in advance
Francesco Menniti
Zhang Yunjun
Mar 25, 2021, 12:49:58 AM3/25/21
to MintPy
Hi Francesco,
Without further info, your average velocity map seems good to me.
MintPy does support exporting the result into the point cloud, using save_kmz_timeseries.py or save_gbis.py.
Cheers,
Yunjun
Message has been deleted
francesco menniti
Mar 25, 2021, 4:51:01 AM3/25/21
to MintPy
thanks for the reply Zhang Yunjun.
thanks for the reply Zhang Yunjun.
Of course I know that PS and DS are expressed in a grid, but this grid seems really too big to me.
Is there any way to minimize this grid and avoid this smoothing?
Thanks again for the answer Zhang.
Cheers,
Francesco
Zhang Yunjun
Mar 27, 2021, 12:07:59 AM3/27/21
to MintPy
Hi Francesco,
The grid size is pixel size, which is determined in ISCE processing, via the multillooking in range and azimuth direction. In order to reduce the grid size (for higher resolution), you could always try to use fewer looks in ISCE processing; at the same time, this will increase the noise level. So you would need to find a suitable compromise yourself, as it varies from area to area and from sensors to sensors.
PS methods generally use temporal and/or spatial filtering to beat down the noise, thus, has a higher spatial resolution; while DS methods generally use multilooking/averaging to beat down the noise, thus resulting in lower resolution. The strength of DS in MintPy is no temporal deformation assumption, thus, suitable for complex temporal behavior. However, if the full resolution is your most important desire, and you know that your study area has a simple linear deformation, ISCE + StaMPS would be a more suitable choice for you.
Lanari et al. (2004) proposed a method for higher resolution results for DS, but this is not implemented in MintPy.
Lanari, R., O. Mora, M. Manunta, J. J. Mallorquí, P. Berardino, and E. Sansosti (2004), A small-baseline approach for investigating deformations on full-resolution differential SAR interferograms, Geoscience and Remote Sensing, IEEE Transactions on, 42(7), 1377-1386, doi:10.1109/TGRS.2004.828196.
I hope this helps to clear,Yunjun
francesco menniti
Mar 31, 2021, 5:32:47 AM3/31/21
to MintPy
thanks Zhang!
you were very clear and exhaustive.
FM
Reply all
Reply to author
Forward
0 new messages