Long unexplained time-to-safepoint (TTSP) in the JVM
1,746 views
Skip to first unread message

Zac Blanco
Jun 4, 2020, 5:07:10 PM6/4/20
to mechanical-sympathy
Hi All,
I'm hoping someone might be able to point me in the right direction with this or offer some ideas.
I've done a lot of research but haven't found any other threads with similar behavior. The closest
one I could find was this which actually never seems like it was solved.
I've been working on this issue for a few weeks. We have a JVM-based server application which
is experiencing long (anywhere from 10s to multiple minutes) pauses. Below is an example of
the safepoint statistics output:
         vmop                    [threads: total initially_running wait_to_block]    [time: spin block sync cleanup vmop] page_trap_count
298.236: no vm operation                  [     385          0              0    ]      [     0     0 21638     1     0    ]  0
         vmop                    [threads: total initially_running wait_to_block]    [time: spin block sync cleanup vmop] page_trap_count
320.877: no vm operation                  [     336          0              0    ]      [     0     0  1978     1     0    ]  0
         vmop                    [threads: total initially_running wait_to_block]    [time: spin block sync cleanup vmop] page_trap_count
336.859: no vm operation                  [     309          1              2    ]      [     0     0  6497     1     0    ]  0
         vmop                    [threads: total initially_running wait_to_block]    [time: spin block sync cleanup vmop] page_trap_count
351.362: no vm operation                  [     294          0              0    ]      [     0     0 32821     0     0    ]  0
         vmop                    [threads: total initially_running wait_to_block]    [time: spin block sync cleanup vmop] page_trap_count
401.189: no vm operation                  [     296          3              2    ]      [     0     0  3471     0     0    ]  0
         vmop                    [threads: total initially_running wait_to_block]    [time: spin block sync cleanup vmop] page_trap_count
427.675: no vm operation                  [     303          0              0    ]      [     0     0 10414     1     0    ]  0
         vmop                    [threads: total initially_running wait_to_block]    [time: spin block sync cleanup vmop] page_trap_count
446.098: no vm operation                  [     346          2              1    ]      [     0     0 48768     1     0    ]  0
These are all printed back-to-back when running the application. The GC logs don't even
indicate that this pause was occurring.
2020-06-04T00:49:40.008+0000: 268.104: Total time for which application threads were stopped: 1.5127234 seconds, Stopping threads took: 1.5089316 seconds
2020-06-04T00:49:42.411+0000: 270.507: Total time for which application threads were stopped: 0.0108752 seconds, Stopping threads took: 0.0065995 seconds
2020-06-04T00:49:42.760+0000: 270.856: [GC (Allocation Failure) [PSYoungGen: 8389120K->1016108K(9786880K)] 8550808K->1177813K(32156672K), 1.8051522 secs] [Times: user=6.83 sys=4.62, real=1.80 secs]
2020-06-04T00:49:44.566+0000: 272.662: Total time for which application threads were stopped: 1.8379623 seconds, Stopping threads took: 0.0267499 seconds
2020-06-04T00:49:46.114+0000: 274.210: Total time for which application threads were stopped: 0.5484401 seconds, Stopping threads took: 0.5438942 seconds
2020-06-04T00:49:47.120+0000: 275.216: Total time for which application threads were stopped: 0.0055404 seconds, Stopping threads took: 0.0007684 seconds
2020-06-04T00:49:50.127+0000: 278.222: Total time for which application threads were stopped: 0.0059341 seconds, Stopping threads took: 0.0005394 seconds
2020-06-04T00:50:02.136+0000: 290.232: Total time for which application threads were stopped: 0.0048284 seconds, Stopping threads took: 0.0008109 seconds
2020-06-04T00:50:07.140+0000: 295.235: Total time for which application threads were stopped: 0.0029092 seconds, Stopping threads took: 0.0004694 seconds
2020-06-04T00:50:31.781+0000: 319.877: Total time for which application threads were stopped: 0.0035001 seconds, Stopping threads took: 0.0012628 seconds
2020-06-04T00:50:34.761+0000: 322.857: Total time for which application threads were stopped: 0.0014956 seconds, Stopping threads took: 0.0002727 seconds
2020-06-04T00:50:55.261+0000: 343.357: Total time for which application threads were stopped: 0.0016439 seconds, Stopping threads took: 0.0004175 seconds
2020-06-04T00:51:36.088+0000: 384.184: Total time for which application threads were stopped: 0.0011020 seconds, Stopping threads took: 0.0001815 seconds
2020-06-04T00:51:56.565+0000: 404.661: Total time for which application threads were stopped: 0.0012547 seconds, Stopping threads took: 0.0003102 seconds
2020-06-04T00:52:29.996+0000: 438.092: Total time for which application threads were stopped: 0.0016347 seconds, Stopping threads took: 0.0002464 seconds
2020-06-04T00:53:26.772+0000: 494.868: Total time for which application threads were stopped: 0.0021074 seconds, Stopping threads took: 0.0003538 seconds
During the time period ~270-494 the application pretty much stopped serving all IO
requests and did not respond to any jstack operations
Hardware information:
OS: RHEL 7.8 (kernel version 3.10.0-1127)
JVM: Oracle JDK 8u161
Machine specs: 72 cores, 754GiB RAM.
about 650 GiB of the memory is allocated to a ramdisk, the JVM application (as you
will see below) has a max heap of 32GiB, and direct memory of 24GiB. This is the
only application running on this server aside from a metrics collection daemon.
The JVM has the following flags specified:
-Xms32g
-XX:MaxDirectMemorySize=24g
-XX:+PrintGC
-XX:+PrintGCDateStamps
-XX:+PrintGCDetails
-XX:+PrintGCTimeStamps
-XX:+PrintGCApplicationStoppedTime
-XX:+PrintSafepointStatistics
-XX:PrintSafepointStatisticsCount=1
-XX:+SafepointTimeout
-XX:SafepointTimeoutDelay=10000
-XX:-UseBiasedLocking
-Xloggc:<path>/logs/gc_worker.log
-Dcom.sun.management.jmxremote
-Dcom.sun.management.jmxremote.local.only=false
-Dcom.sun.management.jmxremote.port=7093
-Dcom.sun.management.jmxremote.rmi.port=7093
-Djava.net.preferIPv4Stack=true
I already read through most of the discussion at these links regarding somewhat
similar behavior:
- https://stackoverflow.com/questions/30393470/what-causes-long-spin-and-sync-times-in-java
- https://groups.google.com/forum/#!msg/mechanical-sympathy/tepoA7PRFRU/-4-FjKbUBwAJ
- https://groups.google.com/forum/#!msg/mechanical-sympathy/htQ3Rc1JEKk/VzSV8iBvBgAJ
- https://groups.google.com/forum/#!topic/mechanical-sympathy/9oeDihc2WiE
- http://mail.openjdk.java.net/pipermail/hotspot-gc-use/2015-May/002262.html
- http://mail-archives.apache.org/mod_mbox/cassandra-user/201610.mbox/%3c1475948419.268606...@webmail.messagingengine.com%3e
The application itself does a lot of mapped file IO against spinning disks. Each mmap
is usually just a few MiB across 12 enterprise-class disk drives or a ramdisk. However,
previously we've been able to max out 10Gbit connections with the same application on
much smaller machines (8-16 cores, 64GiB RAM) without any issue. There are 144
threads doing the mmapped IO at any given time on this hardware.
One of the points that stands out the most in this situation is that the
-XX:+SafepointTimeout doesn't actually print any information about threads failing to come
to a safepoint. From my understanding, any time I get a safepoint statistics log where the
"sync" time is larger than 10000, then I should be getting output to stdout of the thread
names which failed to come to a safepoint. In my logs, there is no such output.
Any ideas for debugging this is greatly appreciated. One thing I have not yet tried is using perf
and kernel uprobes to capture the stacks (as suggested here). The reason I have not tried this
is because this software actually runs on a cluster of ~90 nodes (all the same hardware and
software stack) and the occurrence of the pauses isseemingly random across all of the nodes.
Setting up the uprobes and collecting the data will be a complex task which I haven't had the
time for yet.
Appreciate ideas anyone has to offer
Thanks,
Zac

Jean-Philippe BEMPEL
Jun 5, 2020, 4:36:35 AM6/5/20
to mechanica...@googlegroups.com
Hi Zac,
I would suggest to use JFR to collect events about safepoints/VM Operations. for that you can upgrade to Zulu with at least 8u212 which includes JDK Flight Recorder (JFR).
JFR is bundle into Oracle JDK 8 but with commercial license (but maybe you have subscribed, in this case, just enable it with -XX:+UnlockCommercialFeatures).
You can look for details about how to start FlightRecorder here: https://docs.oracle.com/javacomponents/jmc-5-4/jfr-runtime-guide/run.htm#JFRUH176
In JMC you can edit which events you are collecting, and refine them to have more information about safepoints/VM Operations and also use JMC for analyzing recordings
The advantage is you can let run it on your cluster with barely noticeable overhead.
Regards
Jean-Philippe
--
You received this message because you are subscribed to the Google Groups "mechanical-sympathy" group.
To unsubscribe from this group and stop receiving emails from it, send an email to mechanical-symp...@googlegroups.com.
To view this discussion on the web, visit https://groups.google.com/d/msgid/mechanical-sympathy/05345cdc-fd0b-4ae6-853b-ad8e140005b6o%40googlegroups.com.

Igor Soarez
Jun 5, 2020, 11:13:11 AM6/5/20
to mechanica...@googlegroups.com
Have you looked at page faults?
What happens when I/O to an mmap’ed file triggers a page fault? How can that affect time to safe point?
--
Igor

Gil Tene
Jun 8, 2020, 1:13:21 PM6/8/20
to mechanica...@googlegroups.com
Here is an idea for a quick way to analyze this. Zing has a built-in TTSP profiler (since we pretty much coined the term "TTSP"). You could just download the (free) Zing trial version, run your application on it, see if the TTSP behavior is still there, and potentially get some quick clarity about what is causing it.
Zing will, by default, print out "Detected TTSP" warnings to stderr when it sees any thread experience a TTSP above a detection threshold (the warning threshold defaults to 1 second, but can be set with -XX:SafepointProfilerThresholdMS=<val>). You don't have to wait for a real pause to hit you to find these. Zing runs all threads through a background checkpoint every 5 seconds, so code paths with long TTSPs have a hard time hiding from the detector. Each thread crosses the checkpoint individually at its next safepoint polling opportunity, with no actual pause, and no actual delay in execution. The only time a thread will bear a real cost and interact with IPC is when its TTSP is so long that it crosses the threshold, in which case signals are used to collect context and report it.
For an example of the kind of output you would see when e.g. mapped file page faults are the thing causing long TTSPs, see the below. Note the clear finger pointing at org.apache.lucene.store.ByteBufferIndexInput.readByte() as the culprit in this example.
And explanation of timings in the example:
- The detector fired after not seeing this thread check in for one second (started at 41.768, send the signal at 42.768)
- The signal sent to collect the context took an additional 748msec to respond [likely because the read was held on a page fault].
- The next safepoint opportunity, when it was eventually reached 1.748 seconds after the checkpoint attempt, was at org.apache.lucene.store.DataInput.readVInt(), but it was actually held from reaching that point by a mapped byte buffer read in org.apache.lucene.store.ByteBufferIndexInput.readByte() likely hitting a page fault that took 1.748 seconds to complete...
-- Gil.
Detected TTSP issue: start: 41.768 wait: 1748.384
Dumping stack for thread 0x0000440019600000
"elasticsearch[localhost][search][T#49]" id: 171575 prio: 5 os_prio: 0 sched: SCHED_OTHER allowed_cpus: 000000000ffffffffffffffff
lock_release: 43.516 last_cpu: 9 cpu_time: 25
  0 0x00007fc63245f5bc SafepointProfilerBuf::record_sync_stack(JavaThread*)
  1 0x00007fc6324817e5 JavaThread::poll_at_safepoint_static(JavaThread*)
  2 0x000000003000eae9 StubRoutines::safepoint_handler
  3 0x00000000300dfc73 org.apache.lucene.store.DataInput.readVInt()I
  4 0x0000000031fa91df org.apache.lucene.codecs.blocktree.SegmentTermsEnumFrame.loadBlock()V
  5 0x0000000031f99664 org.apache.lucene.codecs.blocktree.SegmentTermsEnum.seekExact(Lorg/apache/lucene/util/BytesRef;)Z
  6 0x0000000031fad584 org.apache.lucene.index.TermContext.build(Lorg/apache/lucene/index/IndexReaderContext;Lorg/apache/lucene/index/Term;)Lorg/apache/lucene/index/TermContext;
  7 0x00000000319a40f6 interpreter
  8 0x00000000319a3cba interpreter


signal_sent: 42.768 signal_responded: 43.516 state: D wchan: wait_on_page_bit_killable last_cpu: 9 cpu_time: 25
  0 0x00000000300926f2 org.apache.lucene.store.ByteBufferIndexInput.readByte()B
  1 0x00000000300dfacd org.apache.lucene.store.DataInput.readVInt()I
  2 0x0000000031fa9119 org.apache.lucene.codecs.blocktree.SegmentTermsEnumFrame.loadBlock()V
  3 0x0000000031f99664 org.apache.lucene.codecs.blocktree.SegmentTermsEnum.seekExact(Lorg/apache/lucene/util/BytesRef;)Z
  4 0x0000000031fad584 org.apache.lucene.index.TermContext.build(Lorg/apache/lucene/index/IndexReaderContext;Lorg/apache/lucene/index/Term;)Lorg/apache/lucene/index/TermContext;
  5 0x00000000319a40f6 interpreter
  6 0x00000000319a3cba interpreter
  7 0x00000000319a3cba interpreter
8 0x00000000319a3cba interpreterzacdb...@gmail.com
Jun 22, 2020, 4:10:12 PM6/22/20
to mechanical-sympathy
Hi all,
I appreciate the responses. We
looked into switching JVMs. We will try to upgrade to the latest OpenJDK
8u252, but that won't be for a bit - and the Zing VM was ruled out for
now unfortunately. If I can reproduce the issue in an isolated environment
outside the cluster I may try the newer JVMs myself, but so far I
haven't had luck isolating and reproducing it anywhere else.
I
brought up that the application performs IO via mmap in the original
post because from most of my research, mmap can cause the JVM to pause
for an extended period of time if there is a page fault. However, based
on our system instrumentation, nothing seems to suggest that we're
fetching or writing pages out to disk for tens of seconds to multiple
minutes at a time. The most data we mmap at a time is probably about 1MB
or so.
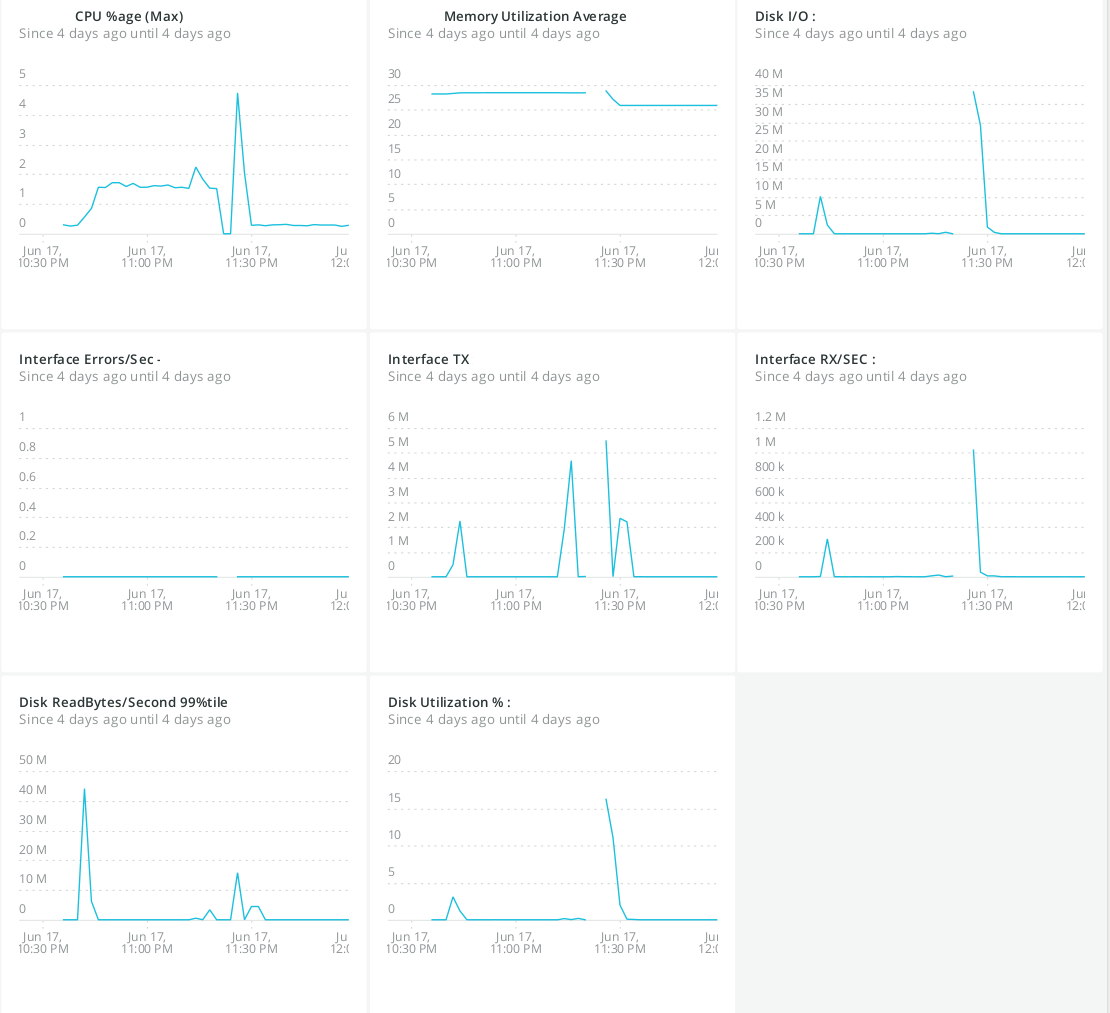
According to our monitoring system
the disk utilization is relatively low. Here's an example of the system
behavior we are seeing.
These
are some pauses we saw with the timestamps (the columns represent the
same as they would from the safepoint output) in the last week.
Op: operation timestamp spin block sync cleanup vmop page-trap-count
Op: no-vm-operation JVM Time: 2020-06-18 05:47:14.972000+00:00; 0ms 0ms 1058341ms 12ms 0ms 0ms
Op: no-vm-operation JVM Time: 2020-06-18 06:05:06.332000+00:00; 0ms 0ms 463072ms 15ms 0ms 0ms
Op: no-vm-operation JVM Time: 2020-06-18 05:47:14.972000+00:00; 0ms 0ms 1058341ms 12ms 0ms 0ms
Op: no-vm-operation JVM Time: 2020-06-18 06:05:06.332000+00:00; 0ms 0ms 463072ms 15ms 0ms 0ms
Here's
the monitoring system info for the ~1.5 hours around the time period
from the events about (timestamps above are GMT, but monitoring is PST).
The spikes in utilization and disk IO don't seem to have a strong
correlation with the times that the JVM paused.
If
mmap is at the root of the issue I would have expected more IO
utilization. From my understanding for mmap to take an extended period
of time it would likely be evicting pages from the page cache, and then
reading the data into memory. That would take a long period of time if
either (1) the only pages that are evict-able are dirty since those need
to be written to disk, (2) if a read from disk took a long amount of time, or some combination of both (1) and (2) .
If the evict-able pages are not dirty, then a page cache miss should
only take approximately the amount of time to read data from disk
because I would expect evicting a page in memory to be a quick
operation. Maybe I have some misconceptions about how the page cache
functions though. Either way, based on the system resource utilization,
it seems like it's not under any serious kind of stress during these time periods.
I am skeptical that it is due to mmap because
of the observed system stats,
but I can't come up with another culprit. One of the pauses above is
1058s - nearly 18 minutes. It's hard for me to reason about how a
single (or even a few) mmap calls could take so long.
This
1000s+ pause is definitely the highest I've seen. I wonder if it could
somehow be attributed to faulty disks which take inexplicably long
amounts of time to read data? The problem with that theory though is
that we see multi-minute pauses pretty consistently across most, if not
all, machines in the cluster. The probability that so many disks could
behave in such similar ways seems low.
Going to continue to investigating the issue. My next steps for looking at this are going to include
- Grabbing kernel and userspace stacks during a pause
-
Gathering info on IO operations and latency with tools like iosnoop ,
iolatency, or bitesize from https://github.com/brendangregg/perf-tools
- Collecting and analyzing stats on syscall latencies
Thanks again for the suggestions,
Zac
zacdb...@gmail.com
Nov 8, 2020, 10:56:29 PM11/8/20
to mechanical-sympathy
I want to give a brief update and some closure to this thread.
After a long period of investigation, we finally determined these long pauses were NOT due to the JVM, but rather caused by the operating system. The machines we were working with had vm.zone_reclaim_mode=1 across all systems. We aren't sure where the configuration came from, but some places around the internet suggested that if the kernel detects high memory access penalties between NUMA domains, it may enable this setting. A kernel patch from 2014 suggests that this should be disabled by default though: https://lore.kernel.org/patchwork/patch/454592/ . I think our application's particular use case exacerbated the problems that zone reclaim brings do to the high amount of IO performed on the ramdisk and churn rate due to the application's data eviction policies. This kernel setting is not new, but seemed to evade us in our search across the internet.
Either way, after setting vm.zone_reclaim_mode=0, all of these long pauses disappeared and the systems started behaving normally. An uneventful end to this thread, but at least we were able to find a culprit.
In case anyone is interested in some reading, I've collected a short list of relevant web pages and articles that led us to determining the issue and some discussion to help us learn more about this setting and the kernel's behavior.
- Zac

Mark Price
Nov 19, 2020, 2:17:22 PM11/19/20
to mechanical-sympathy
Thanks for the write-up; I'm sure the information will be useful to others in the future.
Mark
Reply all
Reply to author
Forward
0 new messages