How to draw illustration of manifold and its tangent space at a point ?
856 views
Skip to first unread message


Ronny Bergmann
Feb 16, 2022, 6:44:43 AM2/16/22
to Manopt
3D graphics are sometimes tricky.
I do some of my illustrations (when it does not involve a whole sphere or no things that overlap in a tricky manner, which TikZ/pgfplots, which has some 3D capabilities (just not z-tracing), see for example slide #3 (note #3 has a few images changing so slide #3 is only on page 12). The advantage is, this is well-programmable (Since you program the graphics in TeX) - but since it is TeX it is also to some extend limited.
For the sphere and SPDs I use Asymptote, where you can find exports in Manopt.jl (see https://manoptjl.org/stable/tutorials/MeanAndMedian.html for examples and https://manoptjl.org/stable/helpers/exports.html for the interfaces in Julia), some exports are available in the old Matlab code here https://github.com/kellertuer/MVIRT/tree/master/helpers/export but haven't looked at that code for years) and you need Asymptote installed ( https://github.com/kellertuer/MVIRT/tree/master/helpers/export ) but it is included in most LaTeX distributions.
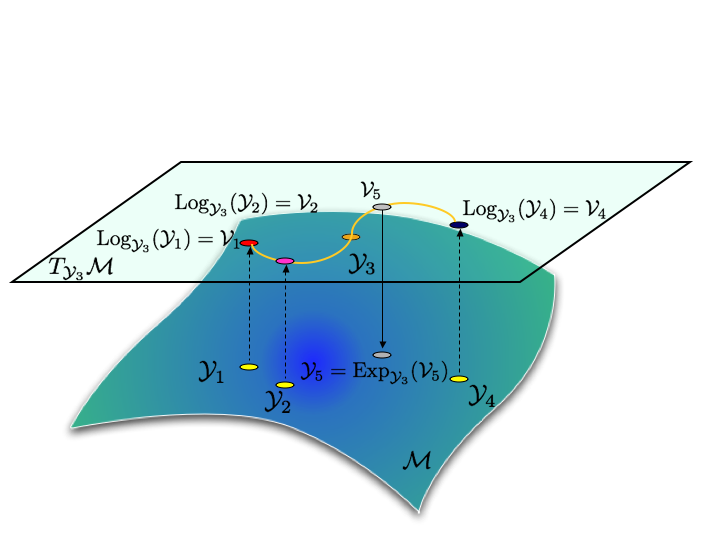
The graphics you show – I am unsure how that was created, the lower (manifold) part especially – the tangent space might be a TikZ overlay actually.
I hope this gives a few starting points, I am not sure how the usual Manopt (Matlab) plotting facilities are.

Nicolas Boumal
Feb 16, 2022, 8:32:43 AM2/16/22
to Manopt
Thanks for weighing in Ronny.
I do not have a good tool for this actually, and would also be interested. I make my figures either by programming them in Matlab, or by drawing them by hand on an iPad. In both cases, I usually just make the figure itself in that way, then I use Tikz to add any latex contents on top of it. This is very handy since it happens all the time that we change notations etc., so the latex parts are just recompiled. Still, for the figure part, I would welcome better tools.
Best,
Nicolas

Alex NotFound
Nov 20, 2022, 2:08:09 AM11/20/22
to Manopt
I follow the penrose project for quite some time. Especially, their paper looks promising for manifold drawing.
But I think they are in a heavy refactoring of the code and I'm not sure if these spherical examples work currently.
Nevertheless, if this realy works out I think it could be a game changer.
How do you see this?
Best,
Alex
Nicolas Boumal
Nov 25, 2022, 10:55:48 AM11/25/22
to Manopt
Thanks for bringing this up! I did not know about this project, it seems quite promising!
Reply all
Reply to author
Forward
0 new messages