Minimum recommended flow rate for PLA
2,378 views
Skip to first unread message

Joseph Adams
Dec 19, 2012, 2:50:49 PM12/19/12
to make...@googlegroups.com
I was wondering if anyone had experimented with or knew of a good resource to determine the recommended minimum volumetric flow rate for PLA at a given temperature to avoid degradation of the material in the nozzle? I'm guessing this is could be one of the problems I am having when I have thin layer prints fail.

pfinucan
Dec 19, 2012, 4:20:55 PM12/19/12
to make...@googlegroups.com
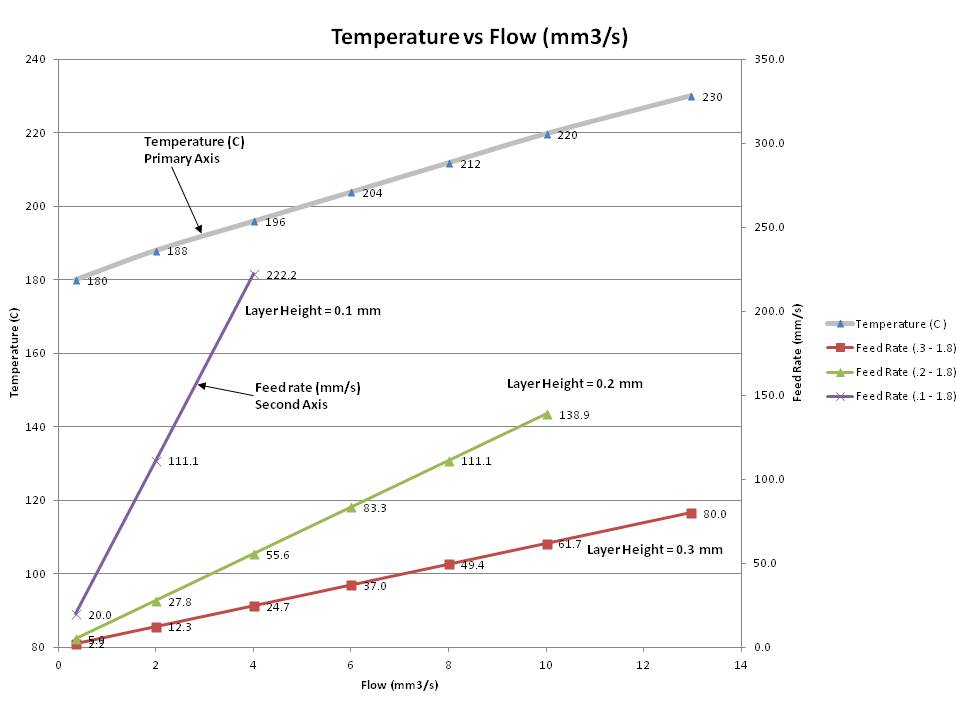
I put together a quick chart. I am assuming that 230C is the correct temperature for a 0.3mm layer height at a speed of 80mm/s. And that 180C is the correct temperature for 0.3mm layer height at 5mm/s (very slow). I am also assuming that the temperature is linear between the to. This may not be a good assumption, but the point of the chart is more to show how the change in layer height makes a big difference on the flow rate and therefore the required feed rate.
The chart has two axis, with the temperature (gray line at top) on the left axis, the three feed rate (mm/s) lines are on the second axis on the right. Volume flow rate is across the bottom. The temperature (gray line) shows the relationship between temperature and the volume of plastic. The three curves are feed rate (mm/s) of three different layer heights. All of the layer heights assume the width over height to be 1.8 (also assumes a rectangle not an oval for the cross-section, should be close)
On the bottom right you can see the 80mm/s point for 0.3 mm layer height. If you draw a line straight up you get to 230C. So you can see to get the same flow rate with 0.2mm layer height feed rate (mm/s) you would have to select would be way up near 180mm/s. I didn't show this point because it isn't practical to ran a feed rate of 180mm/s.
Look at 30mm/s at a layer height of 0.3mm, your temperature should be about 200C, or if you are printing at 0.2mm layer height you need to run at close to 80mm/s to get the same flow.
This chart may assume temperatures that are too low. I need to run some checks, and I will update the thread when I do.
pfinucan
Dec 19, 2012, 4:23:49 PM12/19/12
to make...@googlegroups.com
stupid google, the image may be hidden under the quoted text break...


Adan Akerman
Dec 19, 2012, 6:59:43 PM12/19/12
to make...@googlegroups.com
This is magnificent! I've been frustrated for some time now by the thought that there MUST be a pretty straightforward relationship between print speed and print temperature. But I didn't know the best way to calculate it, nor have the time to go experimental. And it didn't even occur to me that there might be such a dependence upon layer height.
Do I understand correctly you're interpolating between the assumed values stated? 230C for 0.3mm & 80mm/s / 180C for 0.3mm & 5mm/s? Did you choose those values based on testing?
On Wed, Dec 19, 2012 at 4:23 PM, pfinucan <patrick....@gmail.com> wrote:
stupid google, the image may be hidden under the quoted text break...
--
pfinucan
Dec 19, 2012, 9:14:35 PM12/19/12
to make...@googlegroups.com
The start value of 230C for 80mm/s at 0.3mm layer height is a number I have used very successfully and it is what the makerbot default is for the MK8 extruder (I don't actually have a makerbot, I have a reprap with a MK8 extruder, so correct me if I am wrong). The value of 180C is an assumption that is based on the melting temperature of 4043 PLA. This will need to be tested.
The other assumption is that the relationship between temperature and the melt rate per volume is linear. The rate of heat (energy) transfer through conduction is a linear function of temperature difference (I think!!! it has been a while since that class). So since the filament coming into the extruder is always at room temperature, the temperature of the nozzle controls the rate of heat transfer, and needs to be matched to the volume for plastic to be melted.
The nozzle doesn't really know what the layer height is*, it only know hows much plastic you are asking it to melt. So the temperature is a function of flow (mm3/s) which is affected by feed rate, layer height and width over height.
I am running tests on my printer to make sure the slope for temperature/flow rate is correct.
*Layer heights do effect the back pressure which may effect the extruder function.

Eighty
Dec 19, 2012, 9:36:16 PM12/19/12
to make...@googlegroups.com
I probably didn't spend enough time with your chart, but I'll throw out this thought before I forget. When considering flow rate, make sure to compensate for travel (non-feed) time. It would probably be best to average the total build time against the total volume. So the net flow will be a little lower, especially with prints that have a lot of travel.
pfinucan
Dec 19, 2012, 9:53:36 PM12/19/12
to make...@googlegroups.com
Yes, this is a important point. If you have a lot of travel the average filament feed rate can be much lower than the value you entered. Or if you have a lot of short movements the acceleration limits will cause the effective feed rate to me much lower. I had this problem last night printing a 6" x 6" base with text on top, for a model I made. Printing text is hard, it slows the feed rate way down, and caused over heating. I had to manually lower the temperature to get it to work.
Note that the chart also assumes that you are printing close to full speed, with long enough extrusions that the printer is getting up to speed.
Joseph Adams
Dec 20, 2012, 1:53:19 AM12/20/12
to make...@googlegroups.com
Thanks for the chart pfinucan; took me a little time to fully digest it but I think I understand how you've correlated your data and it makes sense. I do have some additional comments but its late so I'll follow up in the morning. In the mean time, here is an interesting article I found that might be helpful (I haven't read it entirely yet).
http://www.protoparadigm.com/blog/2012/04/thing-o-matic-mk7-pla-set-up-and-troubleshooting-mk8
Joseph Adams
Dec 20, 2012, 1:53:51 AM12/20/12
to make...@googlegroups.com
Joseph Adams
Dec 20, 2012, 1:50:13 AM12/20/12
to make...@googlegroups.com
Joseph Adams
Dec 20, 2012, 9:09:21 AM12/20/12
to make...@googlegroups.com
Sorry about the triple post, my email went haywire.
Reply all
Reply to author
Forward
0 new messages