How to interpret MAJIQ analysis figure??
123 views
Skip to first unread message

Huck Thornton
Jan 30, 2021, 12:00:52 PM1/30/21
to majiq_voila
Hi Paul,
Thanks for all your help. I think I have MAJIJQ working now, thanks to your feedback. I am relatively new to the splicing field.
My question is about how to interpret the analysis from MAJIQ. I have an attached an image of an LSV from my analysis.
I am trying to learn more about how to interpret the figure. I am comparing two groups.
The first column shows two different splicing events to exon 26?
The second column shows PSI for group 1? The fourth column shows PSI for group 2?
I am trouble interpreting what the third column means.
Please advise. Thank you.

Caleb Radens
Jan 30, 2021, 12:22:41 PM1/30/21
to Huck Thornton, majiq_voila
Hi Huck,
1st column is a cartoon illustrating the type of local splicing variation (LSV) MAJIQ quantified. This is a target LSV, meaning it's reference exon (Exon 26) is the "target" of splicing from, in this case, two splice donor sites from two distinct exons. The colored lines indicate the junctions splicing to the target LSV's reference exon.
Correct, 2nd and 4th columns are quantified PSI of those two splice junctions for group1 and group2.
The third column is delta PSI (dPSI) which is group2-group1 PSI.
Best,
Caleb
--
You received this message because you are subscribed to the Google Groups "majiq_voila" group.
To unsubscribe from this group and stop receiving emails from it, send an email to majiq_voila...@googlegroups.com.
To view this discussion on the web visit https://groups.google.com/d/msgid/majiq_voila/d1fbc299-f69c-4401-8721-9934d81cc4d8o%40googlegroups.com.
huck.t...@gmail.com
Jan 30, 2021, 2:22:14 PM1/30/21
to majiq_voila
Hi Caleb,
Thanks. I am trying to understand what dPSI means. On your documentation for MAJIQ, which I am pasting below, it says:
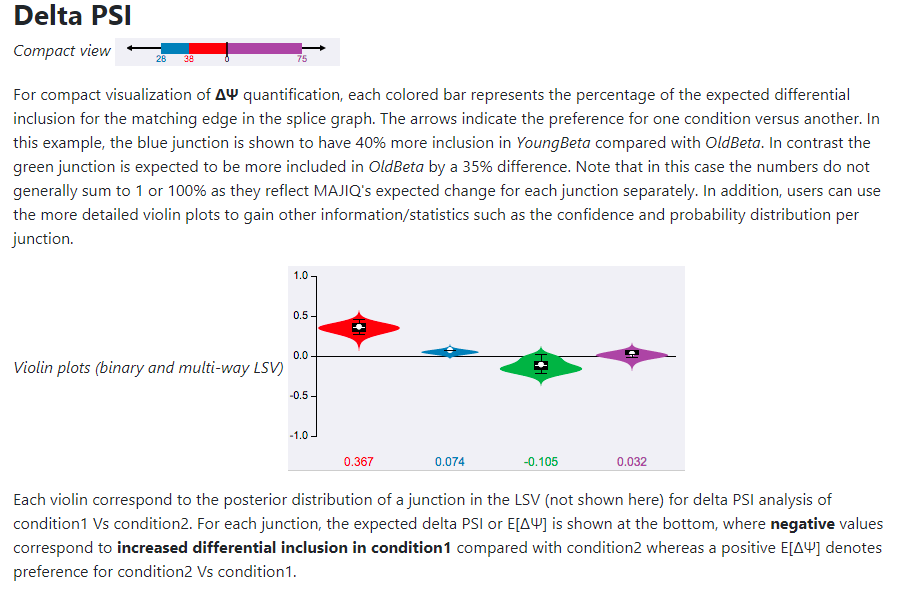
"the blue junction is shown to have 40% more inclusion in young beta compared with oldbeta." Where does this 40% come from? Does it refer to the 0.367 in the violin plot?
Additionally, it says, "the green junction is expected to be more included in OldBeta by a 35% difference."
Where is the 35% coming from? To me it looks like -0.105 in the violin plot?
Thanks

mgaz...@biociphers.org
Feb 11, 2021, 6:15:33 PM2/11/21
to majiq_voila
Hi Huck,
Sorry but the MAJIQ documentation you are referencing does seem to be incorrect. The text is not properly referencing the attached image. We will have to update that.
As Caleb mentioned, you can think of dPSI as the difference in PSI from group 2 and the PSI from group 1. So in your attached example from the original post the blue junction corresponds inclusion of the exon upstream of 26. In group 2 this junction is highly utilized (expected PSI is 0.636) when compared to group 1 (expected PSI of 0.0376). This leads to a positive dPSI value in the 3rd column for the blue junction (E(dPSI) = 0.622) because this junction was used more in group 2 compared to group 1. The simple subtraction of the expected values for PSI will not correspond exactly to the expected dPSI value displayed (we apply a prior, do bootstrapping, etc. to estimate dPSI as a distribution), but it will generally be close.
Please let me know if things are still unclear.
Best,
Matt
Reply all
Reply to author
Forward
0 new messages