reconciling Sashimi plot with MAJIQ splice graph
42 views
Skip to first unread message

Justin Malin
Mar 17, 2021, 6:34:08 PM3/17/21
to majiq_voila
Hi,
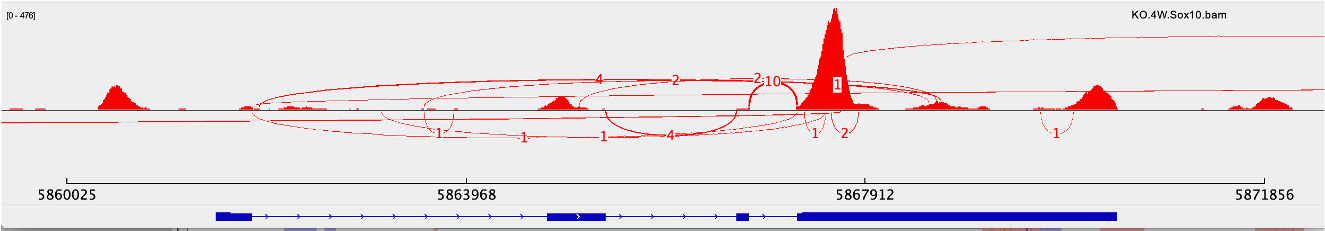
We are are trying to understand the difference in junctions reported by the MAJIQ splice graph and those reported by the Sashimi plot from IGV using the same .bam files (mm10). Specifically, we are examining an experimental cluster of cells which may or may not -- we would like to know -- have an induced inversion of the Klf6 segment that contains exons 2 and 3. The data is from the single cell RNA-Seq Chromium 10X Genomics pipeline. We're hoping to get confirmation for the absence or presence of the inversion by comparing levels of 1-4 junctions as well as 1-2 and 3-4 junctions with levels in control samples where the presence/absence of the inversion is known.
As you can see from the Sashimi plot for the experimental cell cluster, below, there is a relatively high number of 1-4 junctions, consistent with inversion of the region containing exons 2 and 3.
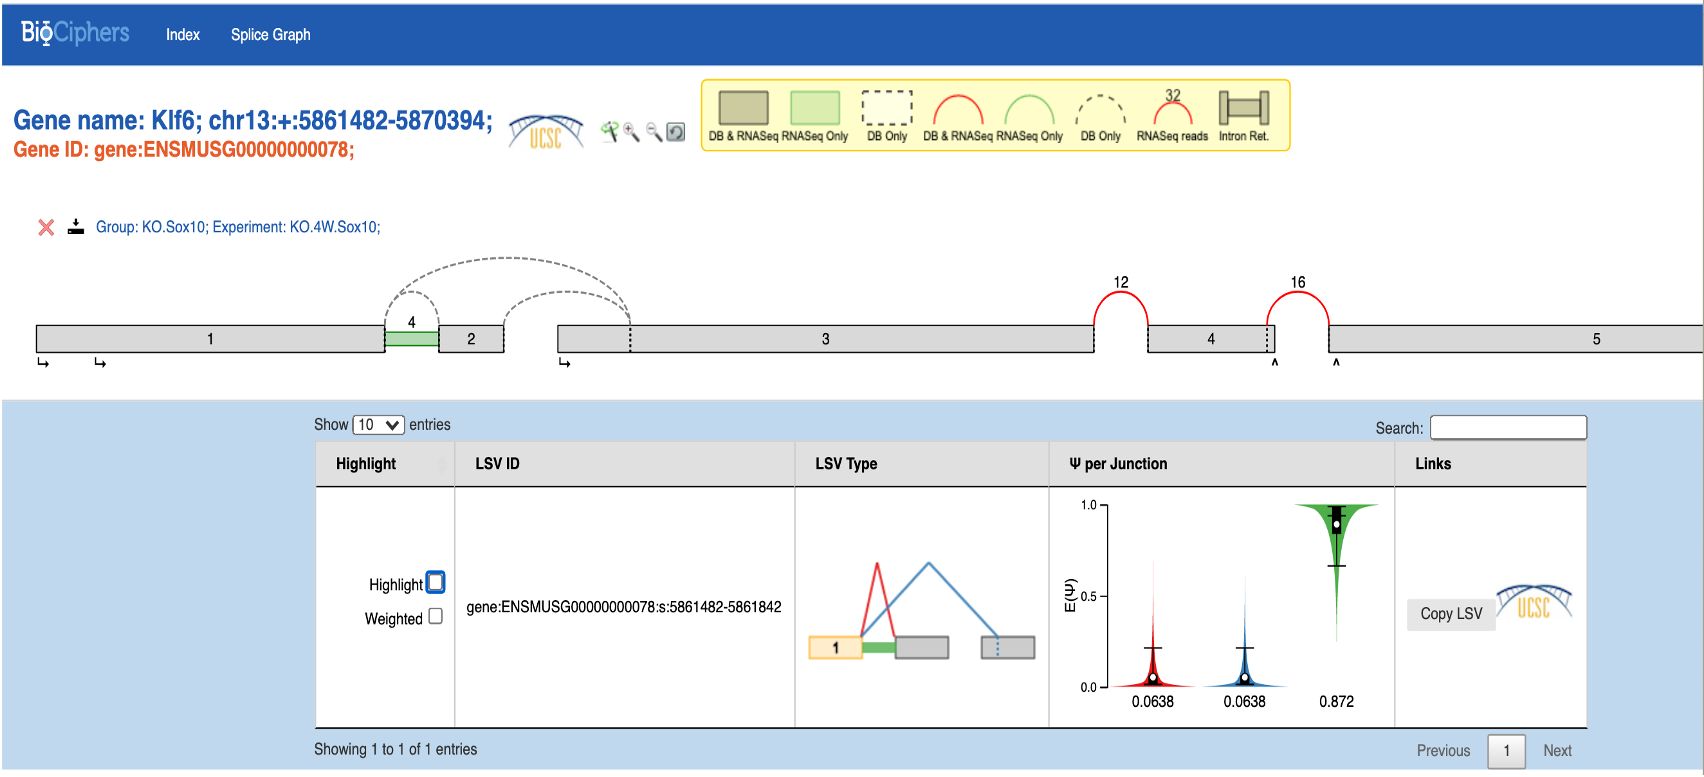
Conversely, the MAJIQ splice plot (below) doesn't register the presence of the 1-4 junctions. Note that the exon numbers Iin the Sashimi plot don't match the MAJIQ numbering, as noted in this conversation and explained by Matthew Gazzara https://groups.google.com/g/majiq_voila/c/miNx8SVsVHM
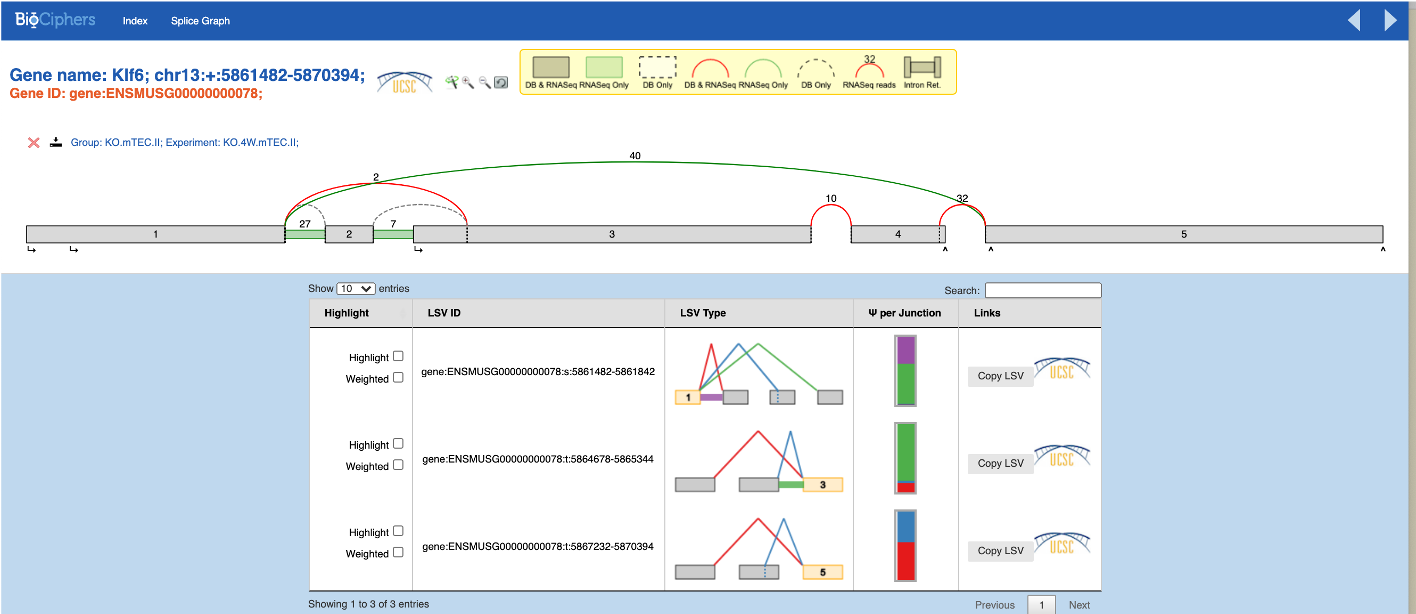
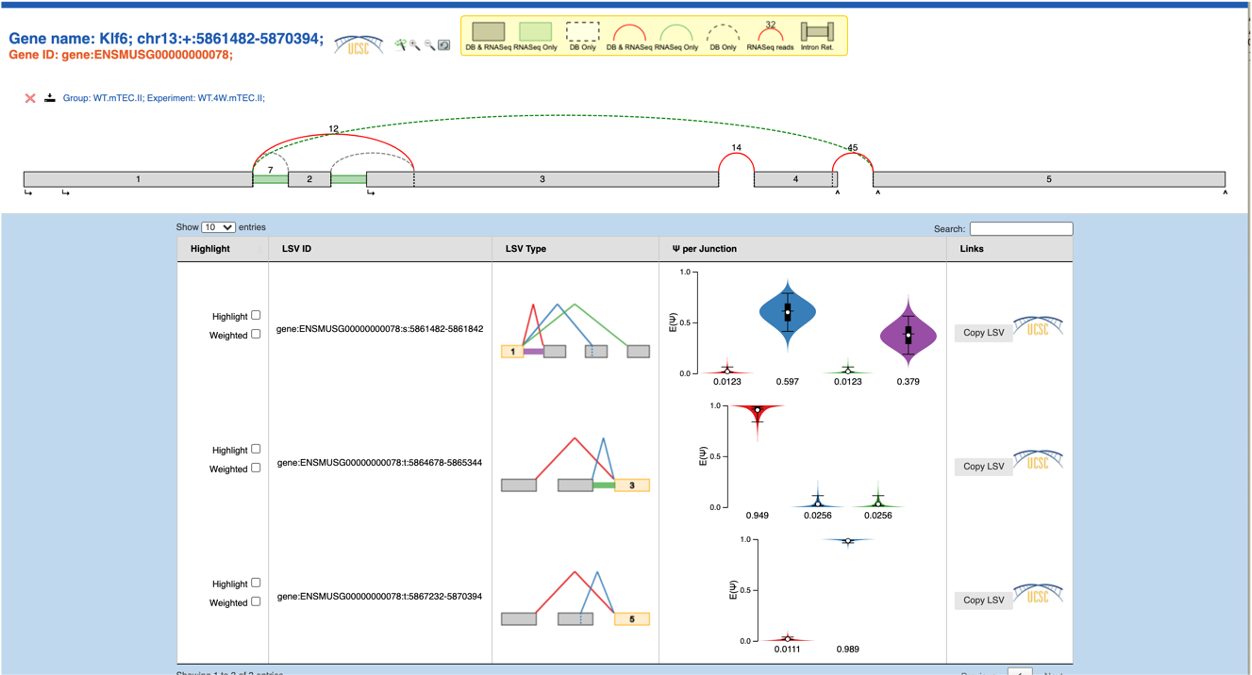
For the control cell clusters, both with and without the inversion, the MAJIQ splice graphs (below) are consistent with our expectation as well as with the IGV Sashimi plots (not shown) based on the same .bam files:
Known inversion of exons 2-3:
No inversion:
How would you account for the qualitative difference in the levels of 1-4 exons junctions reported for the experimental cluster by MAJIQ splice graph and the sashimi plot?
Thanks!
Justin
Reply all
Reply to author
Forward
0 new messages