Choosing a reference point in PSI application in StaMPS_4.1-beta
1,497 views
Skip to first unread message

fırat altıntaş
Sep 26, 2018, 9:09:46 AM9/26/18
to MAINSAR
Hello,
while choosing a reference point, even if ı change the sizes of ref_radius of ref_point in working area which many ps located, again ı can not choose any reference point
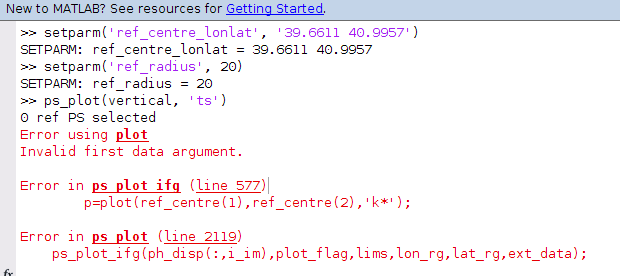
ı am trying to choose ref point like below;
setparm('ref_centre_lonlat', '39.7115 41.0054')
SETPARM: ref_centre_lonlat = 39.7115 41.0054
>> setparm('ref_radius', 20)
SETPARM: ref_radius = 20
and when ı try to get map of ps_plot, ı got an error like below

and ı try to use ref_lon and ref_lat too. The same result.
Am ı doing something wrong ?
Thank you so much for the help

David Bekaert
Sep 26, 2018, 10:26:44 AM9/26/18
to mai...@googlegroups.com
should be specified as a row vector not as a string.
setparm('ref_centre_lonlat', [39.7115 41.0054])
--
You received this message because you are subscribed to the Google Groups "MAINSAR" group.
To unsubscribe from this group and stop receiving emails from it, send an email to mainsar+u...@googlegroups.com.
To post to this group, send email to mai...@googlegroups.com.
For more options, visit https://groups.google.com/d/optout.
fırat altıntaş
Sep 26, 2018, 1:13:47 PM9/26/18
to MAINSAR
Thank you so much David, it works now :)
Can ı ask u one more question ? if the point which ı choose as reference is not constant and has a vertical velocity, while choosing this point as a reference point, can ı provide to make program considering this velocity and calculating all other ps velocities according to this velocity ? Normally it can be done manually but if ı have a option like this, ı want to use.
Thank you so much

Stoorm
Oct 25, 2018, 5:32:21 AM10/25/18
to MAINSAR
Hi all,
I have a similar situation I can't get a plot of mean velocites. When I try to enter ps_plot ('v') or ps_plot('v', 'ts') I get the following result
>> ps_plot('v')
Could not check if this is Envisat
5212196 ref PS selected
Interferogram (1) does not have a reference area
Subscript indices must either be real positive integers or logicals.
Error in ps_plot (line 1963)
maxph=phsort(round(length(phsort)*.999));
Could not check if this is Envisat
5212196 ref PS selected
Interferogram (1) does not have a reference area
Subscript indices must either be real positive integers or logicals.
Error in ps_plot (line 1963)
maxph=phsort(round(length(phsort)*.999));
This is one complete subswath of Sentinel data processed without any errors using snap2stamps. Can anyone help with this? Thanks a lot!
Pic ps_plot('u')
Message has been deleted
fırat altıntaş
Oct 25, 2018, 6:12:35 AM10/25/18
to MAINSAR
Hello Stoorm,
You have this error because probably in your referance area there is no PS point and without PS point u can not choose any referance area.
For not having this error ı advise you first of all use the code setparm('ref_centre_lonlat', [........... ...........]) for choosing your referance point and then you should use
setparm('ref_radius', ?) for choosing the referance area around this point. On question symbol, first u can right 1 later u can try 5 later 10m until program can find any PS point around your referance point. After every choosing ref_radius parameter, try to plot ts, if there is still error, it means it can not still find any PS point and u should increase the radius.
Stoorm
Oct 25, 2018, 8:36:53 AM10/25/18
to MAINSAR
fırat altıntaş,
So i tried different radius values but still got an error. The program finds the necessary points, depending on the radius but this is not enough.
I don't understand what is meant - Interferogram (1) does not have a reference area means? One of the interferograms has no points at all?
Thank you!
>> ps_plot('v-d')
Could not check if this is Envisat
1406 ref PS selected
Interferogram (1) does not have a reference area
Subscript indices must either be real positive integers or logicals.
Error in ps_plot (line 1963)
maxph=phsort(round(length(phsort)*.999));
среда, 26 сентября 2018 г., 16:09:46 UTC+3 пользователь fırat altıntaş написал:

Jose Manuel Delgado Blasco
Oct 25, 2018, 9:15:34 AM10/25/18
to mai...@googlegroups.com
Dear Stoorm,
I am glad that the snap2stamps workflow successfully helped you to do your processing.
For the plotting, I would suggest you to use previous StaMPS versions, as it may solve your problem.
Please try it and let us know.
Cheers
Manuel
--
David Bekaert
Oct 25, 2018, 11:26:54 AM10/25/18
to mai...@googlegroups.com
Hi,
Might be better to try and debug the issues.
Please report the version of stamps you are using.
If you are using git, can you provide the version number of git to we can track it.
I suggest you put a keyboard in the code at the location of the error message
i.e. just above line 1963 in ps_plot
Let us know how:
- phsort looks like
- does it contains nans? ie.e. sum(sum(isnan(phsort)))
- what the value is if length(phsort)
Thanks,
D.
Stoorm
Oct 25, 2018, 12:23:23 PM10/25/18
to MAINSAR
Hi David,
Thanks for your response.
I am using the StaMPS 4.1-beta_20180814 version from Git. With corrected ps_load_initial_gamma.m (fix bug in nan reject )
ps_plot code from 1947 to 1967:
if ref_ps~=0
ref_ph=(ph_disp(ref_ps,:));
mean_ph=zeros(1,size(ph_disp,2));
for i=1:size(ph_disp,2)
mean_ph(i)=mean(ref_ph(~isnan(ref_ph(:,i)),i),1);
if isnan(mean_ph(i))
mean_ph(i)=0;
fprintf(['Interferogram (' num2str(i) ') does not have a reference area\n'])
end
end
clear i
ph_disp=ph_disp-repmat(mean_ph,n_ps,1);
end
phsort=sort(ph_disp(~isnan(ph_disp)));
if isempty(lims)
maxph=phsort(round(length(phsort)*.999));
minph=phsort(ceil(length(phsort)*.001));
lims=[minph,maxph];
if isempty(lims)==1
fprintf(['Interferograms do not contain data.\n'])
end
David Bekaert
Oct 25, 2018, 12:31:39 PM10/25/18
to mai...@googlegroups.com
Ok thanks.
Suggest to add above line 1963:
keyboard
and then try:
- phsort
- sum(sum(isnan(phsort)))
- length(phsort)
D.
Stoorm
Oct 25, 2018, 12:41:49 PM10/25/18
to MAINSAR
if isempty(lims)
phsort
sum(sum(isnan(phsort)))
length(phsort)
maxph=phsort(round(length(phsort)*.999));
minph=phsort(ceil(length(phsort)*.001));
Results:
phsort
sum(sum(isnan(phsort)))
length(phsort)
maxph=phsort(round(length(phsort)*.999));
minph=phsort(ceil(length(phsort)*.001));
Results:
>> ps_plot('v-d')
Could not check if this is Envisat
1406 ref PS selected
Interferogram (1) does not have a reference area
Could not check if this is Envisat
1406 ref PS selected
Interferogram (1) does not have a reference area
phsort =
0×1 empty single column vector
ans =
0
ans =
0
0×1 empty single column vector
ans =
0
ans =
0
Subscript indices must either be real positive integers or logicals.
Error in ps_plot (line 1966)
maxph=phsort(round(length(phsort)*.999));
maxph=phsort(round(length(phsort)*.999));
David Bekaert
Oct 25, 2018, 2:29:35 PM10/25/18
to mai...@googlegroups.com
I believe you have nans in your data somewhere.
sum(isnan(ph_disp))
If that is the case and this equals the number of PS for example, you might want to check some of the variables that are used to calculate the velocity.
e.g. go to the case you are plotting and see if there are any NaN's int he data there.
D.
Stoorm
Oct 25, 2018, 4:26:26 PM10/25/18
to MAINSAR
It seems so there is NaNs. In what variables it is better to check?
phsort
sum(sum(isnan(phsort)))length(phsort)
sum(isnan(ph_disp))
maxph=phsort(round(length(phsort)*.999));
phsort =
0×1 empty single column vector
ans =
0
ans =
0
0×1 empty single column vector
ans =
0
ans =
0
ans =
5212196
5212196
Subscript indices must either be real positive integers or logicals.
Error in ps_plot (line 1967)
maxph=phsort(round(length(phsort)*.999));
maxph=phsort(round(length(phsort)*.999));

volkan
Dec 28, 2018, 7:30:16 AM12/28/18
to MAINSAR
Hello,
26 Eylül 2018 Çarşamba 16:09:46 UTC+3 tarihinde fırat altıntaş yazdı:
I want to ask a question. I usually start the process with stamps(1,6) and after ps_plot. I realized that I made a big mistake by not selecting the reference point.
So, in which step the reference point is selected? Please, give me some detail.
Thank you.
26 Eylül 2018 Çarşamba 16:09:46 UTC+3 tarihinde fırat altıntaş yazdı:
David Bekaert
Dec 28, 2018, 11:12:28 AM12/28/18
to mai...@googlegroups.com
reference is done on the fly during plotting.
e.g. if you plot the velocity the reference is set for each IFG and the velocity is calculated on the fly.
Same of all the other plotting options.
If you load the variables manually (*.mat variables) those likely do not have the reference set.
It would be better to use ps_plot with the -1 option if you want to export the data as used for the plotting.
Then load the saved variable typically called ps_plot***.mat
Cheers,
D.
--

ma...@gfz-potsdam.de
Feb 16, 2019, 3:40:32 AM2/16/19
to MAINSAR
Hello Stoorn,
Did you solve your problem with ps_plot('v')? I have the same issue and I don't know how to plot the velocity?
Cheers
ma...@gfz-potsdam.de
Feb 18, 2019, 5:14:08 AM2/18/19
to MAINSAR
Hi David,
I have the same error:
>> ps_plot('v')
Could not check if this is Envisat
114 ref PS selected
Interferogram (1) does not have a reference area
Subscript indices must either be real positive integers or logicals.
Error in ps_plot (line 1967)
maxph=phsort(round(length(phsort)*.999));
maxph=phsort(round(length(phsort)*.999));
Below you mentioned to check the variables that are used to calculate the velocity. Can you specify where I can find it? When I do ps_plot('u', 1, 0, 0, 1), the reference area of Ifg. 1 contains values.
Thanks for your help.
Rene
David Bekaert
Feb 18, 2019, 9:27:55 AM2/18/19
to mai...@googlegroups.com
Suspect that there are NaNs in your data.
Variables constraining the reference area are in getparms/setparm ref*
You could try and make it the complete interferogram so see how much of the data has NaN's in it.
D.
ma...@gfz-potsdam.de
Feb 18, 2019, 10:27:30 AM2/18/19
to MAINSAR
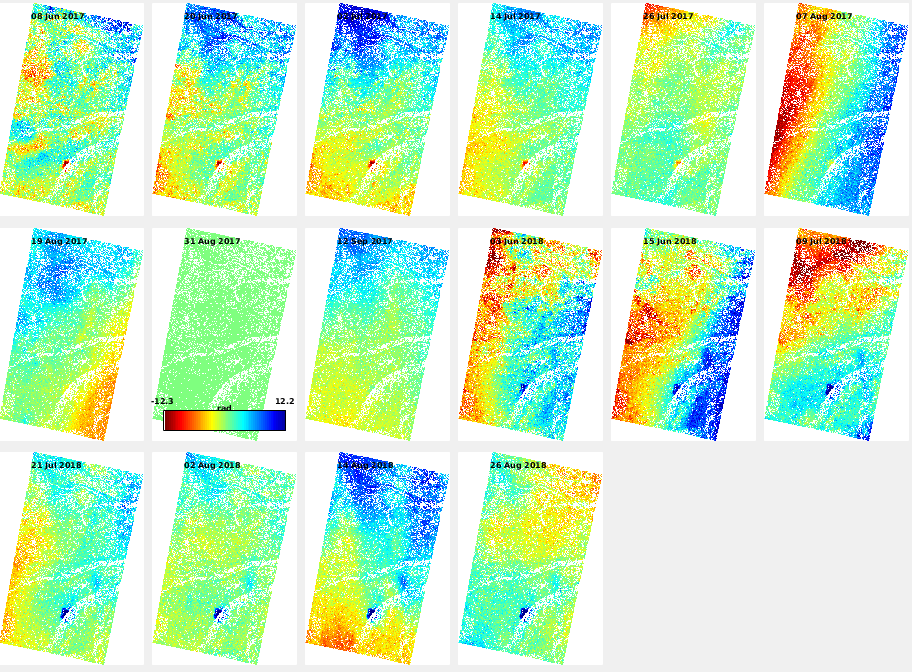
As you can see in the attached file, there are a lot of NaNs in the data. I set the ref_centre_lonlat as indicated with the star and the ref_radius is 20.
There are also two other ref* parameters:
ref_lat: [-Inf Inf]
ref_lon: [-Inf Inf]
ref_lon: [-Inf Inf]
Currently they are set to Inf. What do they indicate?
Cheers,
Rene
Rene
Feb 18, 2019, 12:18:35 PM2/18/19
to MAINSAR
I'm sorry that this is off the topic of this thread but I have to add another question:
When I plot the mean Amplitude in the background with ps_plot('u-dmo',5) I get partial black background (see attachment), and the data are not geocoded anymore.
Also, when I try to put the DEM in the background with ps_plot('u-dmo',2), I get the following error:
>> ps_plot('u-dmo',2)
Could not check if this is Envisat
Deramping computed on the fly.
**** z = ax + by+ c
114 ref PS selected
GETPARM: plot_dem_posting=90
Error using ps_load_dem (line 62)
Cannot find demparms.in in this directory, parent or grandparent
Error in ps_plot_ifg (line 331)
demfile=ps_load_dem;
Error in ps_plot (line 2123)
ps_plot_ifg(ph_disp(:,i_im),plot_flag,lims,lon_rg,lat_rg,ext_data);
I know that mt_extract_info creates the demparms.in. When I call it, it tells me that there is no master.res in the main folder. How can I solve this?
Many thanks in advance.
Rene
David Bekaert
Feb 18, 2019, 2:03:43 PM2/18/19
to mai...@googlegroups.com
Stamps was initially written with support of DORIS.
So any of the other processors added in are "mimicking" some of the DORIS files, in other to get more of the stamps features.
I do not recall what it is exactly lookign for as i do not often plot on the DEM.
Perhaps look it it does a grep for a given filename, width, length.
Correct the amplitude is not geo-coded is mistaken.
See more details in ps_plot.m help.
I have seen this partical amplitude plot before.
If not mistaken stamps makes this amplitude backgroun when it does not exist.
So upon a re-plotting, it would load it again.
I suspect it was made for a patch and now you are plotting for a merged of patches.
Perhaps see which file it loads and move it in a temp folder and run the plotting command again.
D.
David Bekaert
Feb 18, 2019, 2:06:52 PM2/18/19
to mai...@googlegroups.com
Hi,
From the plot its hard to see if there are NaNs.
Stamps will be down-selecting points, so regions prone to snow/decorelation will be less densely covered with points.
if you can plot ps_plot('v') without problems you phases are ok.
If not, best is to load the phase matrix and see if there are NaN's in the rows.
e.g. ph_sb2.mat.
if the above went fine and ps_plot(v-d) or ps_plot(v-m) or ps_plot('v-dm') is givign you a hard time, then you have nans in 'd' or 'm'
Would also check like d, m etc in slca2.mat if not mistaken.
Cheers,
D.
Rene
Feb 19, 2019, 4:39:18 AM2/19/19
to MAINSAR
Hi,
I appreciate your fast answers David. With ps_plot('v') the script plots ph_uw. I checked, there are no NaNs included.
My study area is strongly prone to decorrelation due to snow.
I try to follow the ps_plot script between lines 1947 to 1959, since "Interferogram (1) does not have a reference area" comes from here:
if ref_ps~=0
ref_ph=(ph_disp(ref_ps,:));
mean_ph=zeros(1,size(ph_disp,2));
for i=1:size(ph_disp,2)
mean_ph(i)=mean(ref_ph(~isnan(ref_ph(:,i)),i),1);
if isnan(mean_ph(i))
mean_ph(i)=0;
fprintf(['Interferogram (' num2str(i) ') does not have a reference area\n'])
end
end
clear i
ph_disp=ph_disp-repmat(mean_ph,n_ps,1);
end
phsort=sort(ph_disp(~isnan(ph_disp)));
Earlier in the script it calls ref_ps=ps_setref; to set the reference area. I hope its not too stupid to ask, but where is ps_setref coming from?
Cheers,
Rene
David Bekaert
Feb 19, 2019, 10:54:45 AM2/19/19
to mai...@googlegroups.com
Its a function in the matlab folder of stamps.
It will return you a set of indices which it loads the variables from to be plotted.
I suspect one of the variables has a nan in there somewhere.
You could also have made your reference region in an area where there is no-data or PS left
When you look at the ps_plot option you are picking you can see which variables are loaded (see the section where it switches between cases)
D.
Rene
Feb 20, 2019, 9:18:48 AM2/20/19
to MAINSAR
Hi David,
ps_setref is working fine. In line 1934 (just before the error message) of ps_plot, ph_disp is called with:
ph_disp=ph_all(:,ifg_list);
The variables for the case('v') are loaded starting from line 1369:
case {'v'}
uw=load(phuwname);
ph_uw=uw.ph_uw;
% subtract of oscilator drift in case of envisat
ph_uw = ph_uw-ph_unw_eni_osci;
clear uw
switch(value_type)
case {'v'}
fig_name = 'v';
case {'v-d'}
uw=load(phuwname);
ph_uw=uw.ph_uw;
% subtract of oscilator drift in case of envisat
ph_uw = ph_uw-ph_unw_eni_osci;
clear uw
switch(value_type)
case {'v'}
fig_name = 'v';
case {'v-d'}
I'm not sure, but when I look at the following commands it appears that the ph_uw variable is not defined as ph_all. Could that be the reason?
Cheers,
René
David Bekaert
Feb 20, 2019, 10:20:37 AM2/20/19
to mai...@googlegroups.com
When the data is loaded it will be subtracting components. Some of which are a element by element multiplication of arrays.
I suggest you go to the case you are plotting, and inspect each of these variables before they are subtracted and merged into ph_all for NaNs.
D.
Rene
Feb 21, 2019, 11:56:38 AM2/21/19
to MAINSAR
Okay, after long searching I found the following solution:
The parameters 'lambda' and 'heading' were set to NaN. Lambda is used for velocity calculation between lines 1787-1799 in ps_plot. I don't know where and when that was changed. Not during stamps(1,1), that's for sure. Also, I realised that the parameter 'platform' disappeared from the parms.mat. I added all three values manually, which isn't very gallantly, but for now its sufficient (I hope).
Thanks again David!
Rene

peyman heidarian
Mar 5, 2022, 4:02:35 PM3/5/22
to MAINSAR
Hi Stoorm,
How did you solve the issue? what was the solution? Could you please let me know.
Reply all
Reply to author
Forward
0 new messages