STAMPS: unwrapping, plotting, accuracy and interpretation of results

Tormod Urke
Dear Andy/members of MAINSAR
I have processed two subsets using STAMPS. It is a mountainous area, rural areas. The first subset is a location where there should be no major deformation going on, and with relatively high average coherence (should allow for good deformation estimation/proving the method). The other subset is more vegetated and with more extreme topography, but with proven deformation (static GPS measurements) in the range of 5-15mm/year.
Subset1: 1088 x 3340 pixels (SLC)
Subset2: 845 x 4575 pixels (SLC)
SUBSET 1
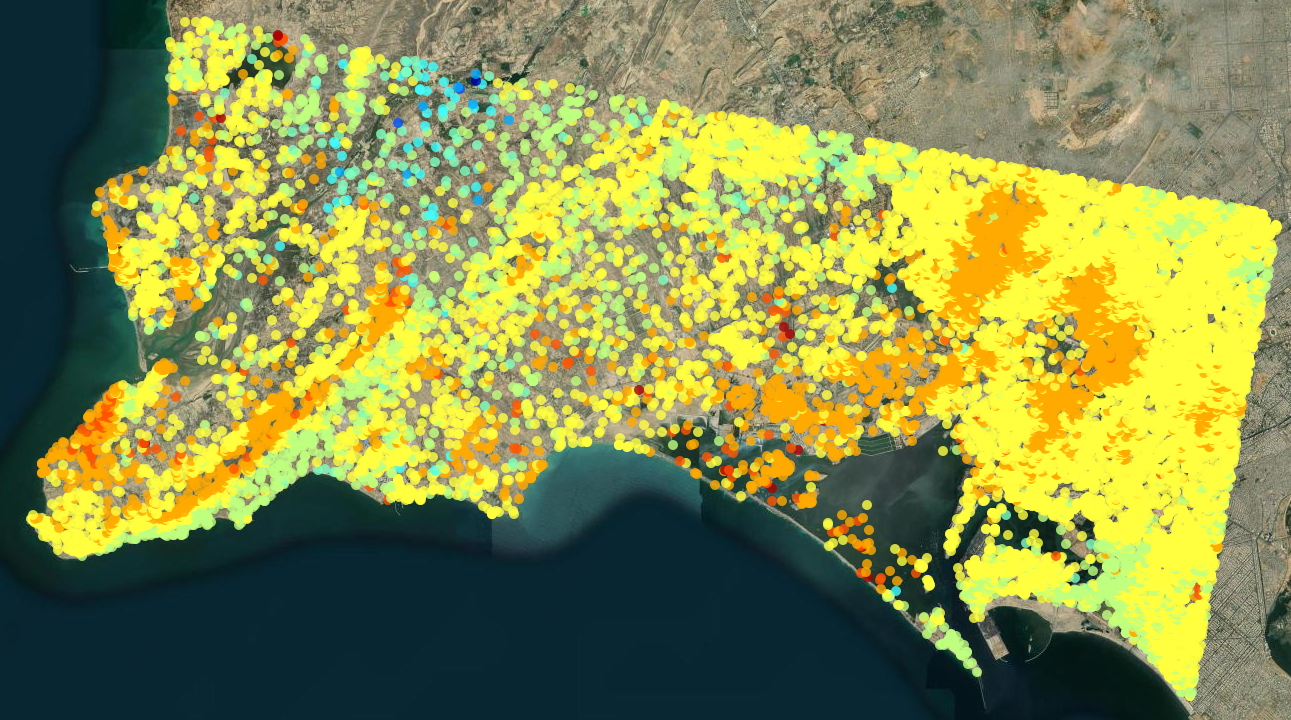
Shows deformation in the range 0 – 5 mm/year in most places, also in places where no deformation is expected (however, I do not have any ground truth data/there may actually be some deformation going on in this location).
PLOT: plot_ps(‘u-dm’)
PLOT: plot_ps(‘v’)
SUBSET 2
Shows deformation in the range 0 – 5 mm/year in most places, corresponds more or less to actual GPS measurements in some locations.

PLOT: ps_plot(‘u-dm’)

PLOT: ps_plot(‘v’)
PLOT: GPS measurements vs. STAMPS results. GPS Measurements = total deformation (vert + hor) / years between measurements (mm/yr).
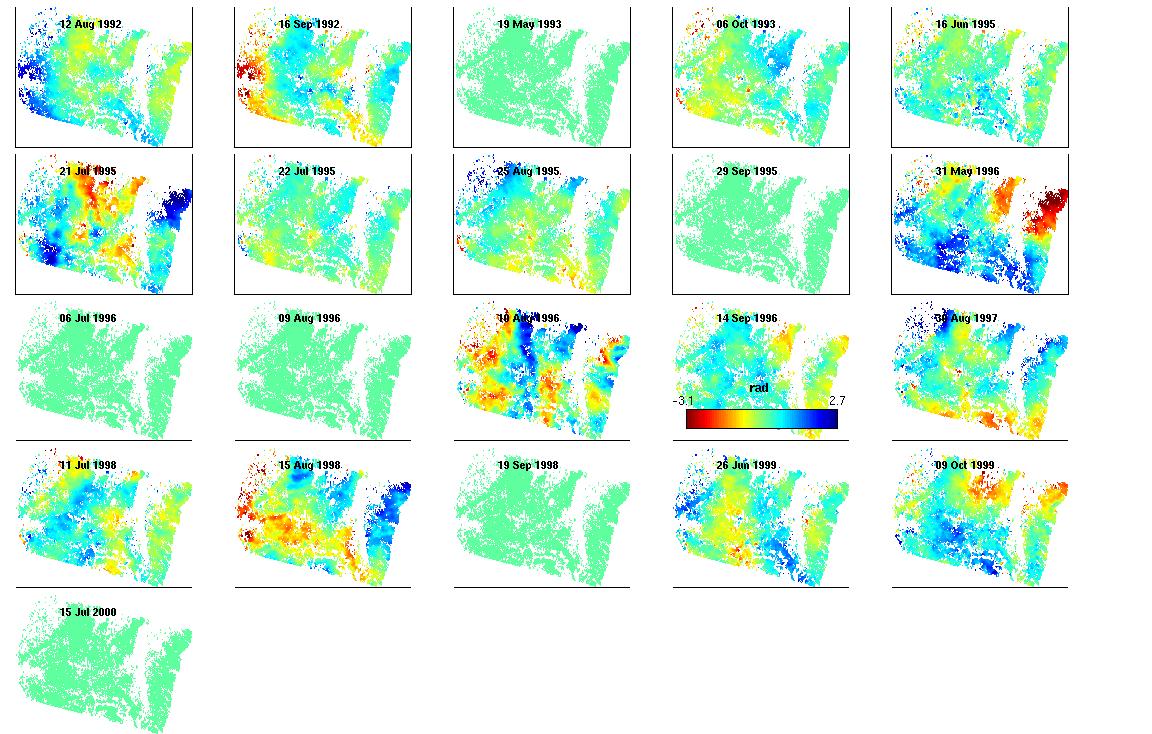
I have used 16 interferograms in unwrapping/estimating the deformation.
My questions are:
1) What is going on in subset 1 – is the low deformation rates estimating indicating “no significant deformation” in most places?
2) I have plotted the velocities using mean_v.xy created from ps_output in matlab (after running stamps(1,8)). Are these numbers corrected for DEM error/orbit ramps? Are there any of the outputs that estimates std/accuracy of the estimated deformation rates?
3) Subset 2 – Unwrapping errors or actual deformation going on? Should I exclude more of the interferograms?
Any help in interpreting the results will be appreciated – what accuracy should be reported? Are the deformation estimates significant (where can I find the statistics for each PS)?
Best regards,
fezzic
Student, University in Oslo

JY
From glancing at your 'image010', it seems that your area of interest
has very large relief in topography. This might give the orographic
effect, i.e. different atmosphere condition between river valley and
mountain slope. Maybe you can try plotting the deformation result
with 'ps_plot('u-dms'), and 'ps_plot('s') to see estimated atmospheric
effect for slave images, and let us know if that's more comparable
with GPS observation?
cheers,
JY
On Jan 14, 10:42 pm, Tormod Urke <tormod.u...@gmail.com> wrote:
> Dear Andy/members of MAINSAR
>
> I have processed two subsets using STAMPS. It is a mountainous area, rural
> areas. The first subset is a location where there should be no major
> deformation going on, and with relatively high average coherence (should
> allow for good deformation estimation/proving the method). The other subset
> is more vegetated and with more extreme topography, but with proven
> deformation (static GPS measurements) in the range of 5-15mm/year.
>
> Subset1: 1088 x 3340 pixels (SLC)
>
> Subset2: 845 x 4575 pixels (SLC)
>
> *SUBSET 1*
>
> Shows deformation in the range 0 – 5 mm/year in most places, also in places
> where no deformation is expected (however, I do not have any ground truth
> data/there may actually be some deformation going on in this location).
>
> * *
>
> PLOT: plot_ps(‘u-dm’)
>
> PLOT: plot_ps(‘v’)
>
> * *
>
> *SUBSET 2*
>
> Shows deformation in the range 0 – 5 mm/year in most places, corresponds
> more or less to actual GPS measurements in some locations.
>
> * *
>
> PLOT: ps_plot(‘u-dm’)
>
> PLOT: ps_plot(‘v’)
>
> PLOT: GPS measurements vs. STAMPS results. GPS Measurements = total
> deformation (vert + hor) / years between measurements (mm/yr).
>
> I have used 16 interferograms in unwrapping/estimating the deformation.
>
> My questions are:
>
> 1) What is going on in subset 1 – is the low deformation rates
> estimating indicating “no significant deformation” in most places?
>
> 2) I have plotted the velocities using mean_v.xy created from
> ps_output in matlab (after running stamps(1,8)). Are these numbers corrected
> for DEM error/orbit ramps? Are there any of the outputs that estimates
> std/accuracy of the estimated deformation rates?
>
> 3) Subset 2 – Unwrapping errors or actual deformation going on? Should
> I exclude more of the interferograms?
>
> Any help in interpreting the results will be appreciated – what accuracy
> should be reported? Are the deformation estimates significant (where can I
> find the statistics for each PS)?
>
> Best regards,
>
> fezzic
>
> Student, University in Oslo
>
> image008.jpg
> 118KViewDownload
>
> image009.jpg
> 54KViewDownload
>
> image006.jpg
> 62KViewDownload
>
> image010.jpg
> 234KViewDownload
>
> image007.jpg
> 70KViewDownload
Tormod Urke
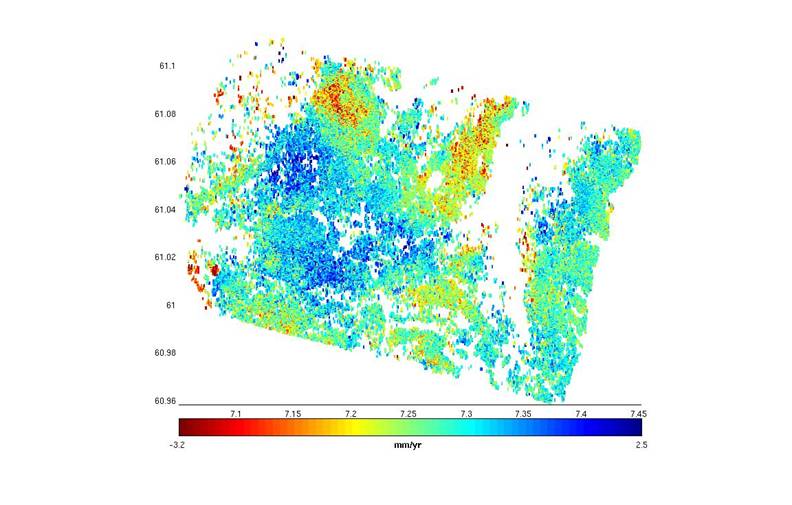
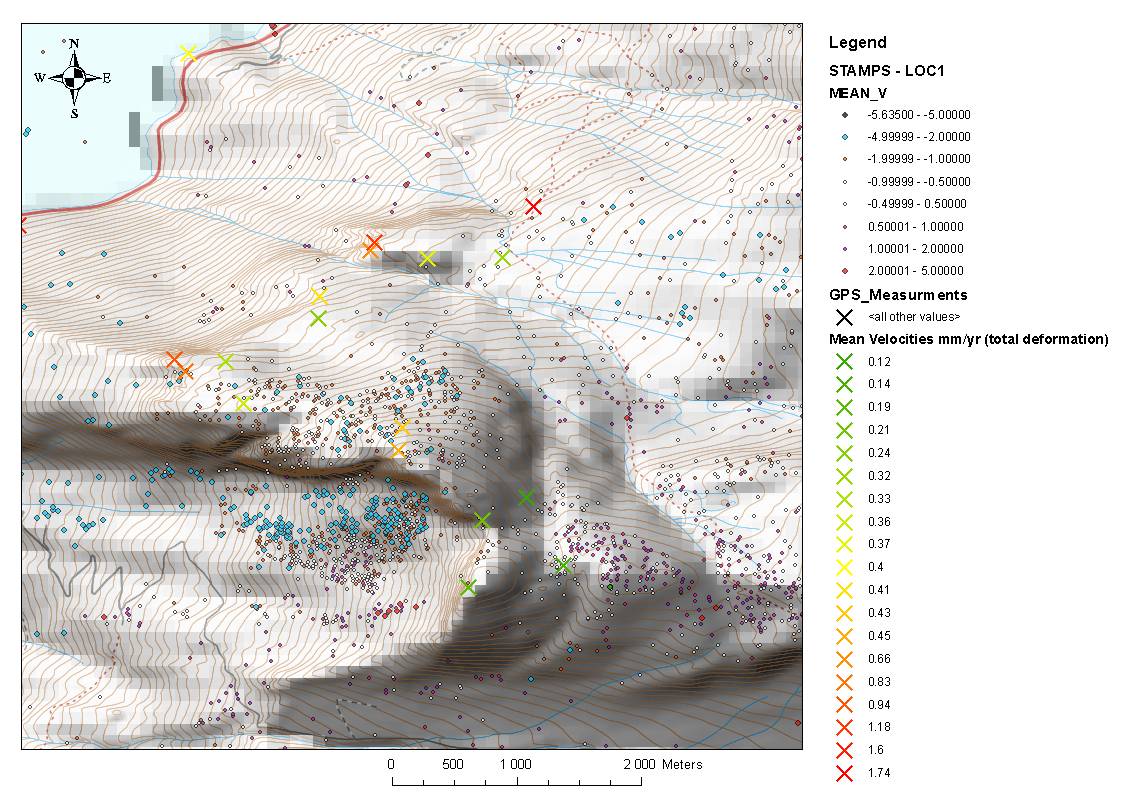
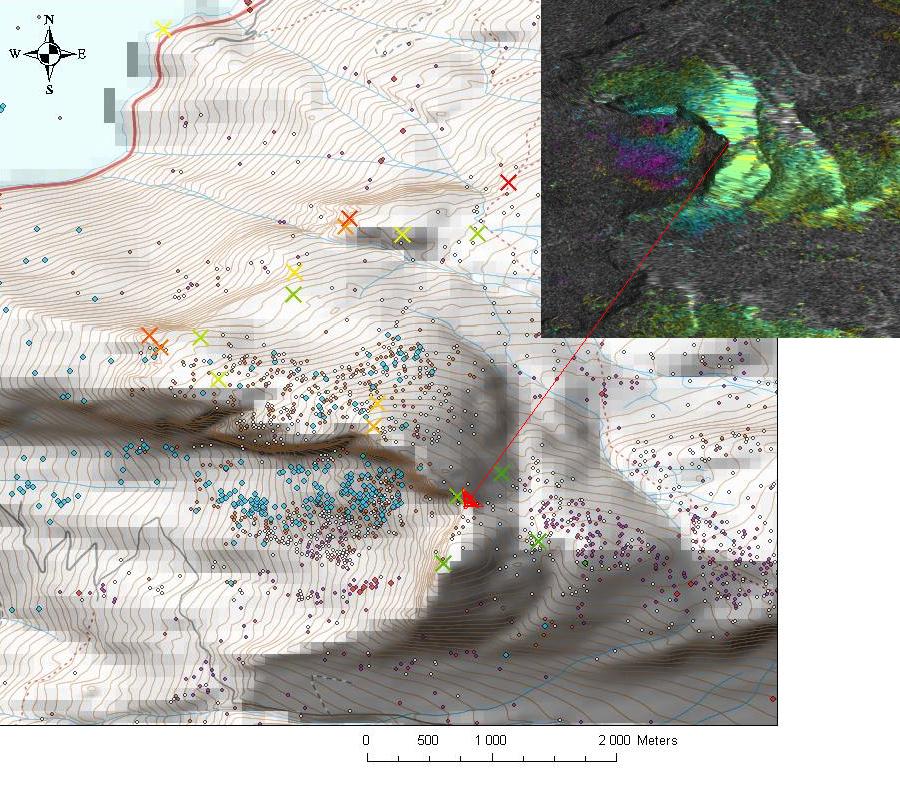
Thank you for your reply JY: I have attached my ps_plot('s') and ps_plot('u-dms') for both locations (LOC0 and LOC1). As you point out, for my LOC1 (image010) there is a large relief in topography, from 0 [m] MSL to 1700 [m] MSL.
1) How may I output the values (ASCII) from e.g. ps_plot('u-dms') / convert them to mean velocities over all the interferograms? I have used ps_output and plotted the values from ps_mean_v.xy to create image010 above - as far as I understand these values are not corrected for AOE/DEM errors?
2) Regarding my questions about accuracy/significant deformation: when I plot ps_plot(vs-d) I get stddev of 0 - 3mm/yr. Are these numbers to thrust?
best regards, fezzic

Karsten
To output your results in ASCII, it is easiest to use the -1 option in
the plotflags, e.g. ps_plot('u-dms',-1). In stead of plotting, this
will
create a .mat file called 'ps_plot_u-dms.mat' of your results, where
the
u-dms part naturally depend on what you are "plotting". Load this into
your workspace, and the matrix 'ph_disp' contains your results. The
rows
of the matrix consists of the phase value for each pixels, and the
columns represents the number of interferograms. The latitude/
longitude
of every pixel can be obtained by using:
load psver
psname=['ps',num2str(psver)];
load(psname,'lonlat')
which will result in a matrix with two columns, giving the longitude
in
columns 1 and latitude in column 2 for every point. Making an ASCII
file
out of this should be trivial.
Regarding your second question, it is not really a matter of trusting
I
would say. StaMPS calculates a mean velocity per pixel (MLV), and the
standard deviation is just a measure of how all individual velocity
(i.e. the velocity per interferogram) corresponds to the mean
velocity.
In other words, it is a measure for the dispersion of the individual
measurements with respect to the mean velocity. So if you expect a
constant deformation, you would expect a small standard deviation. If
you however expect deformation in only half of your interferograms,
you
can expect larger standard deviations. So the answer I guess is: It
depends... How the standard deviation is computed exactly can be
found
in the m-file "ps_mean_v.m".
Regarding your plots, although the u-dms looks better than the u-dm
you
sent last time, do they now also correspond better to your gps data?
I hope this helps!
Regards,
Karsten
> ps_plot-(s)-LOC0.jpg
> 252KViewDownload
>
> ps_plot-(u-dms)-LOC0.jpg
> 336KViewDownload
>
> ps_plot(s)_LOC1.jpg
> 264KViewDownload
>
> ps_plot(u-dms)_LOC1.jpg
> 288KViewDownload
fezzic
I have now written the (u-dms) results to ASCII files, and calculated
the mean velocities using a modified ps_mean_v where I load the
ph_disp data from the .mat file created from ps_plot('u-dms',-1). The
results are more or less the same as before, except some changes; it
tends to lower the deformation estimates on the hills, while the
valleys get higher deformation rates.
I'm still not to sure whether the results are "correct" (significant)
or not. As far as I know the study area, I'm expecting higher
deformation rates (~10-15mm/yr) in some places (LOC1). In LOC0 I'm not
expecting much deformation at all, but both subsets ends up in the
same deformation domain. (-5mm/yr -> +5mm/yr). The results do not
correspond better to my GPS data now. In image010.jpg there is
unfortunately an error: All GPS deformations rates must be multiplied
with a factor of 10, my mistake when making the figure. I must
emphasize that the deformation most likely are unlinear. The GPS
measurments clearly indicate deformation, although with varying
magnitude from year to year (measurements from 2005 - 2006 - 2007 -
2008).
1) Any suggestions for further investigations/interpretation of the
results?
2) Is there an easy way to create velocity output files from phase
matrices, such as ph_uw / ph_disp ? I have modified ps_mean_v.
3) GAMMA is using a regression method to estimate linear atmospheric
delay. Is STAMPS using the same linear model to estimate height
dependent atmosphere?
Regards,
fezzic
JY
On Jan 18, 8:28 pm, Tormod Urke <tormod.u...@gmail.com> wrote:
> Dear JY/members of MAINSAR
>
> Thank you for your reply JY: I have attached my ps_plot('s') and
> ps_plot('u-dms') for both locations (LOC0 and LOC1). As you point out, for
> my LOC1 (image010) there is a large relief in topography, from 0 [m] MSL to
> 1700 [m] MSL.
>
> 1) How may I output the values (ASCII) from e.g. ps_plot('u-dms') / convert
> them to mean velocities over all the interferograms? I have used ps_output
> and plotted the values from ps_mean_v.xy to create image010 above - as far
> as I understand these values are not corrected for AOE/DEM errors?
>
I believed you divide your data by 4pi and multiply by wavelength
(5.6cm). Another way is track the code in ps_plot('v-ds'), and see
how it is done.
> 2) Regarding my questions about accuracy/significant deformation: when I
> plot ps_plot(vs-d) I get stddev of 0 - 3mm/yr. Are these numbers to thrust?
That number is a lot better than my area. If you don't like the large
number of standard deviation, you probably can use this to create a
mask and mask out your data with high standard deviation?
A qestion: in your location 0 (LOC0.jpg), was there virtually no
deformation at all?
cheers,
JY
Tormod Urke
1) Yes, I divided by 4pi/lambda*1000 (m->mm).I was just wondering whether there was a predefined function for displacement->velocity conversion (that also calculates mean std of velocity). It's OK now.
matlabcode: ph_uw_dis=double(ph_uw_dis/4/pi*lambda*1000)';
2)
LOC0: Virtually no deformation at all - it's a mountain plateau, mostly with bare rock. I have selected this location to "prove" the method, should be able to get good/thrustworthy PS-results.
LOC1: GPS measurments show deformation in the range of 0 (no deformation) up to 10-15mm/year (note: error in image010.jpg: multiply yearly deformation rates by a factor of 10). This is the location that I'm really interested in. I have attached a DINSAR interferogram spanning a little more than one year (456 days); Bperp is 17m -> Clearly deformation going on. One fringe equals 28mm (2.8cm). Maximum deformation is approx 2.8/3cm. The interferogram also show that the coherence is marginal.
I'm trying to pinpoint/quantify what error sources affects the results. Right now I'm leaning towards the sum of all decorrelation factors: DEM errors, topography effects, baselines, atmosphere, vegetation... Any input to the discussion are helpful.:)
What type of location are you working with JY?
Best regards,
fezzic
--
You received this message because you are subscribed to the Google Groups "MAINSAR" group.
To post to this group, send email to mai...@googlegroups.com.
To unsubscribe from this group, send email to mainsar+u...@googlegroups.com.
For more options, visit this group at http://groups.google.com/group/mainsar?hl=en.
JY
Your GPS result in the 1st post looks really odd! The GPS stations to
the north in the lower altitude are showing 1.74 mm/yr (need to
multiply by 10?) while a two, three contour line higher, the value
drops to 0.1 mm/yr? In your GPS, you mentioned it was 'total
deformation'? Was it xyz of GPS? and did you projected the data to
radar LOS? or does it matter in your case? Is there a fault there?
Some of my comparison (here in one post <http://groups.google.com/
group/mainsar/msg/cb19c31f62892c6b>) showed that GPS and PS results
were quite comparable. Our own leveling results also agree with PS
results in most place except the most difficult terrain (highly
vegetated steep mountain). Do you have any other geodetic data? Is
the time of GPS and radar images similar?
I don't really think vegetation, DEM play a large part in error
sources. Those seem to be effectively estimated. I believe
unwrapping errors, atmosphere contribution are more likely the error
sources.
I'm working on deformation around Taiwan.
By the way, this is a nice discussion thread!
Karsten
With regard to the error source I would agree with JY, atmosphere and
especially unwrapping errors are the most likely causes.
If you are not bored with making plots for us, could you maybe post
your wrapped interferograms ('w' or 'w-dm')?
Karsten
Tormod Urke
I've now studied the GPS measurments more closely. I have now projected them to radar LOS. It is not a continous GPS logging; the GPS points have been measured 4 years in a row using static GPS; summer season 2005, 2006, 2007 and 2008. I have calculated the average yearly deformation as LOS deformation vector divided by numbers of years between the GPS measurements.
When projecting the deformation and standard deviations for the positions (from static GPS processing) I see that it is hard to say anything certain from the GPS measurments; They are not showing a clear linear trend, except for a few of the points. Clearly more than one issue here..
The overall trend seems, for me, more or less correct in the STAMPS results, however some areas clearly are affected by unwrapping errors. It also seems that the areas with most deformation (up to 10-15mm/yr) are underestimated - unwrapping errors?
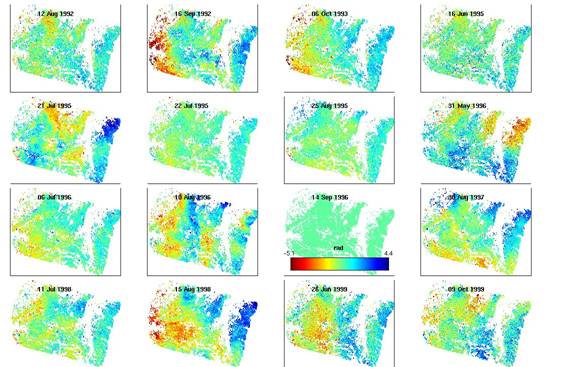
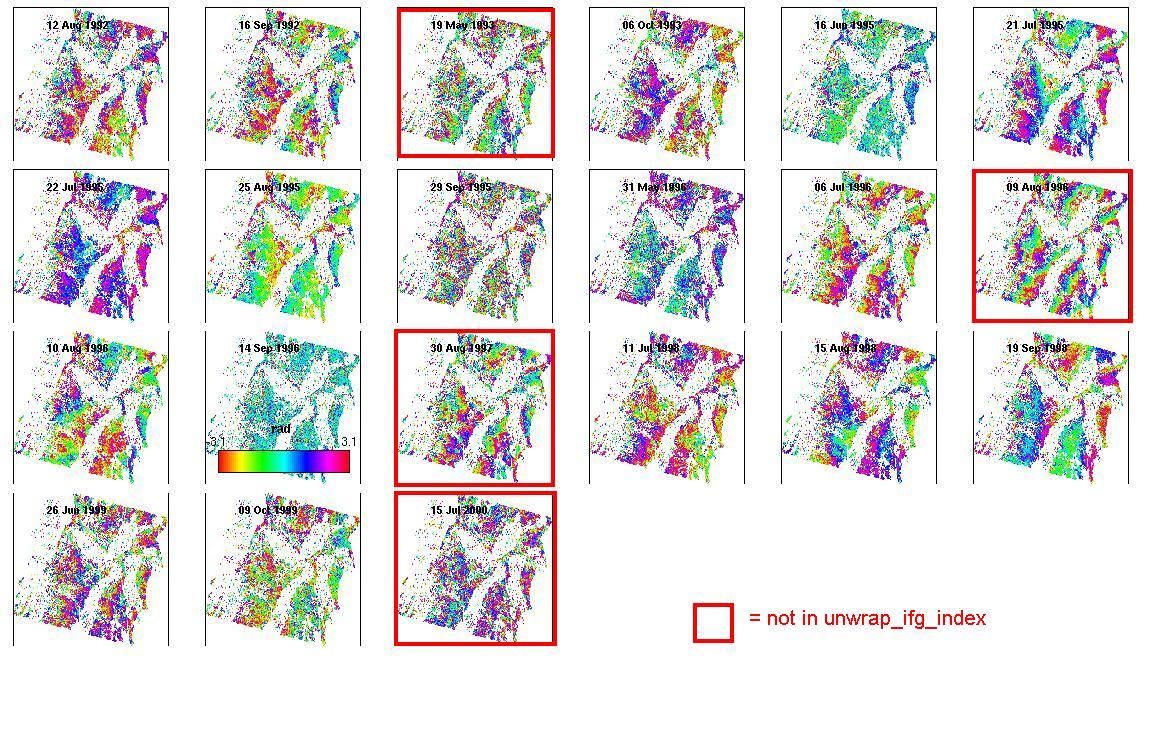
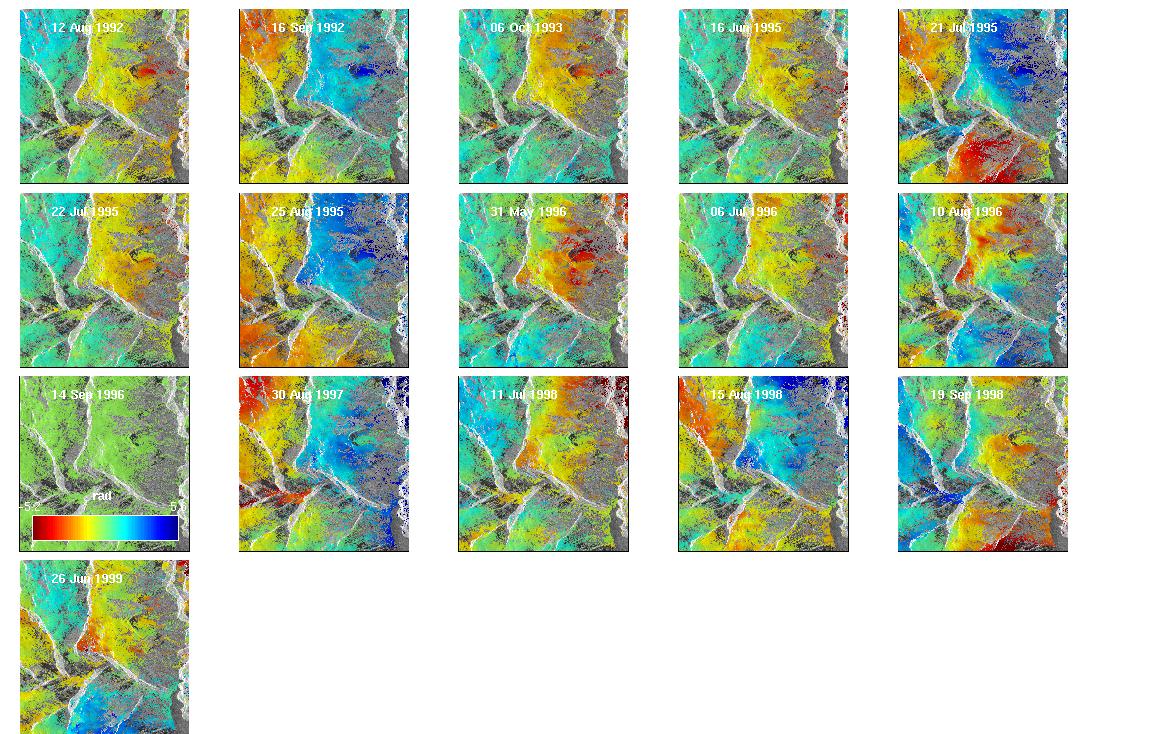
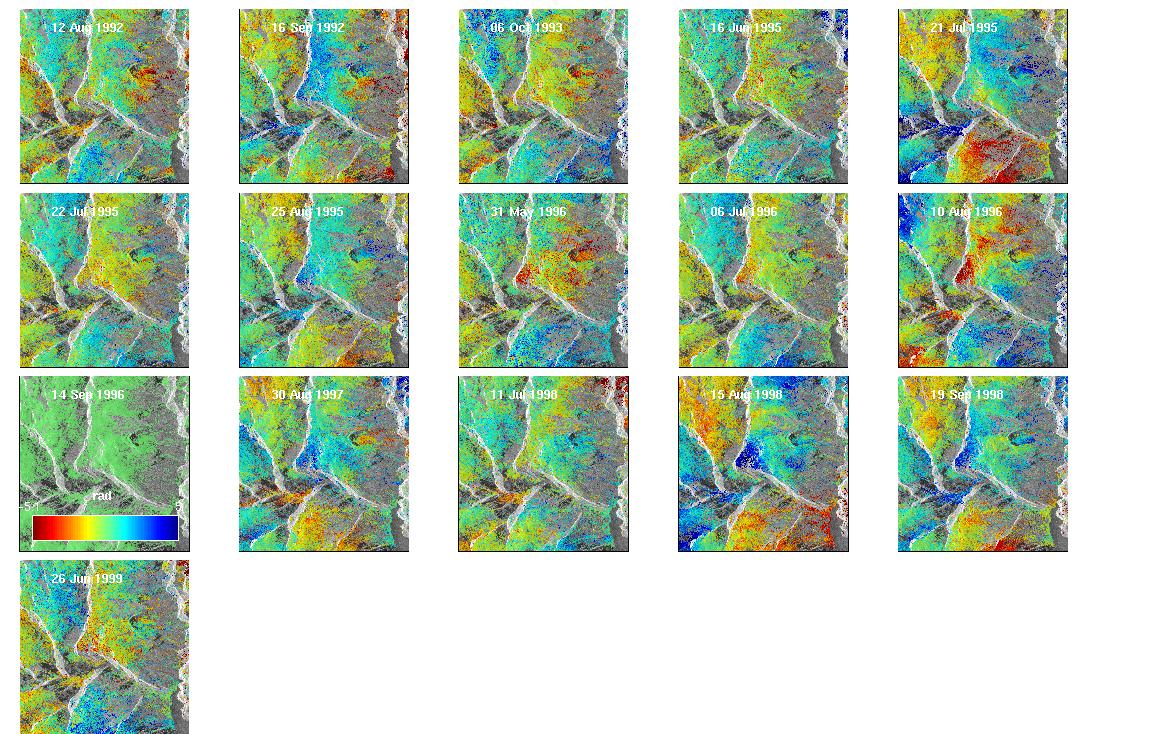
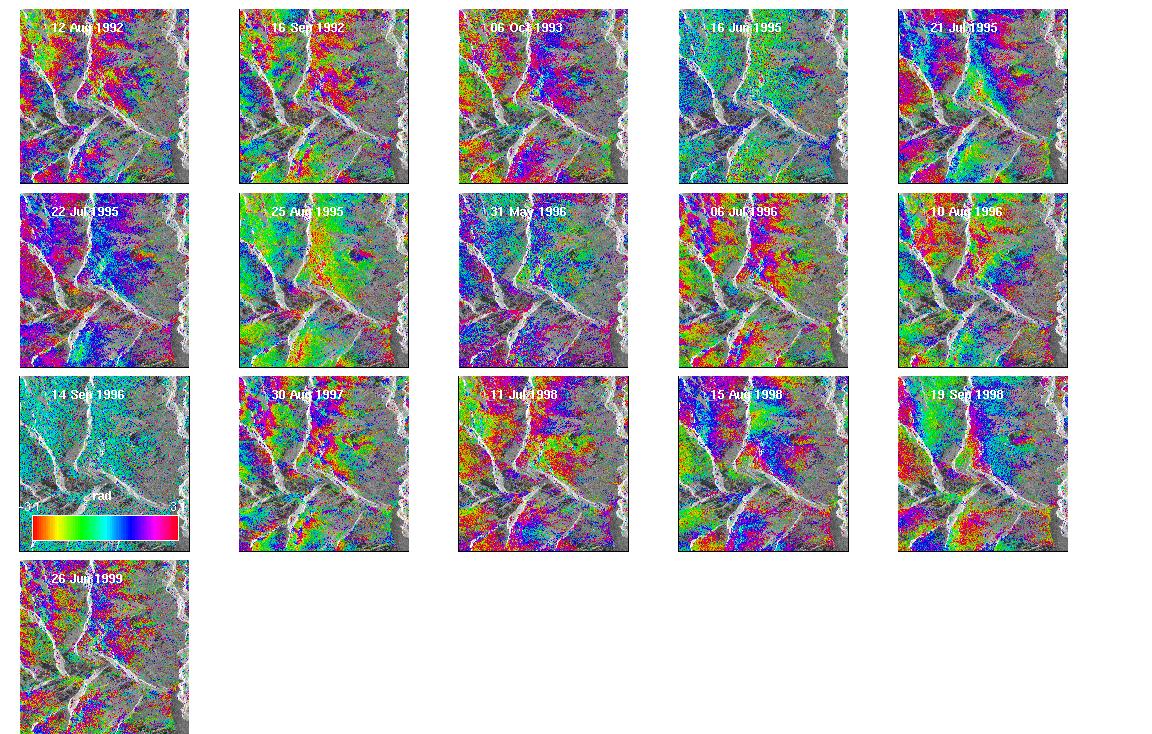
Karsten, attached plots for ps_plot(w) and ps_plot(w-dm). I have marked the interferograms that are not unwrapped/used in the final solution (removed from unwrap_ifg_index). Will it affect the results if first delete the directories for the interferograms not used in the final solution? I.e, will I get more PS-candidates based on better statistics?
Regards,
fezzic
Karsten
Your wrapped interferograms look off. There is a signal running
through the entire interferograms (at least some of them, like ), even
over discontinuities (the ridgelines or mountainsides?).
See the interferograms like 6th juli '96 or 21st juli '95. It seems
this signal is dominating your solution, and it does not look like a
deformation signal. Might be residual flat earth phase? What kind of
orbits did you use? You can clearly see this signal affecting the
unwrapped solutions between 16th of june 95 and 10th of august '96,
where there is a diagonal trend in your solution.
Yes, removing noisy interferograms can certainly increase the number
of PS selected. However, I think this is not the main problem in your
case.
Karsten
Karsten
I just realized subtracting the orbital ramps estimated for all slaves
might largely fix your problem. Try plotting 'u-dmo' and see if this
helps remove the trend in the aforementioned interferograms, it should
I guess.
Karsten
JY
I think Karsten maybe correct that there's an orbital effect in your
wrapped interferograms. Can you try to find out the Bperp of Aug.
1996 image? Is it really big? (compared to say, Jun. 1995?)
Do you happen to have leveling result in your region of interest?
And do you process the static GPS results? and finally on StaMPS, do
you process the data with small baseline algorithm?
cheers,
JY
Tormod Urke
Late reply; I have tried to recalculate the stamps-solution using fewer interferograms to avoid the one's with largest errors (orbital errors, low coherence).
A1) I'm using Delft precise orbits
A2) The geodetic GPS data is already processed (static GPS network using reference points), I have just projected them in radar LOS. One GPS measurement a year = not very precise, but should give the overall trend. They show somewhat larger deformations than my stamps-results, although the general trend corresponds well.
A3) Baselinedata:
>> ps_info
1 12-Aug-1992 -395 m
2 16-Sep-1992 588 m
3 06-Oct-1993 385 m
4 16-Jun-1995 19 m
5 21-Jul-1995 254 m
6 22-Jul-1995 219 m
7 25-Aug-1995 242 m
8 31-May-1996 -69 m
9 06-Jul-1996 573 m
10 10-Aug-1996 374 m
11 14-Sep-1996 0 m
12 30-Aug-1997 608 m
13 11-Jul-1998 -385 m
14 15-Aug-1998 23 m
15 19-Sep-1998 -129 m
16 26-Jun-1999 523 m
Number of stable-phase pixels: 46163
A4) No leveling data (it's very steep and vegetated below the treeline)
A5) I have tried to run small baseline in stamps, but due to rather sparse acquisitions it is not very well connected and the results are not good
Q: I have attached plots (in radar geometry) after the recalculation of stamps for LOC1. Clearly some issues with phase unwrapping over the valleys - or? Comments? Experience from other locations? I do have some problems understanding the coupling of the different error sources and to point out what's going on.
Cheers,
fezzic
JY
If your result shows the same trend as GPS's, then I guess you are
seeing more signals than noise now.
I saw that there is an area of relative subsidence in your mean
velocity map (in the valley, with red and yellow points, by the river
(?), at around -3mm/yr). In your u-dms plot, the same area is showing
some fluctuation? This may cause an interesting problem regarding how
you calculate velocity --> if you only take two points in time, and
calculate the velocity, this will be very different from when you take
multiple points in time and use least-square to fit the velocity as
long as the velocity in the area is net linear!
So, maybe the reason your PS velocity is small compared to GPS is
nothing more than difference in how you calculate velocity? Just a
thought.
cheers,
JY
> > mainsar+u...@googlegroups.com<mainsar%2Bunsu...@googlegroups.com >
> > .
> > For more options, visit this group at
> >http://groups.google.com/group/mainsar?hl=en.
>
>
>
> LOC1_(o).jpg
> 284KViewDownload
>
> LOC1_(s).jpg
> 291KViewDownload
>
> LOC1_(u-dmo).jpg
> 319KViewDownload
>
> LOC1_(u-dms).jpg
> 327KViewDownload
>
> LOC1_(v-do).jpg
> 174KViewDownload
>
> LOC1_(w).jpg
> 367KViewDownload
>
> LOC1_(w-dmo).jpg
> 360KViewDownload
