How can I be more specific when using a conditional fit model?
16 views
Skip to first unread message

EWalsh
Sep 30, 2021, 2:04:52 AM9/30/21
to lmfit-py
Hi,
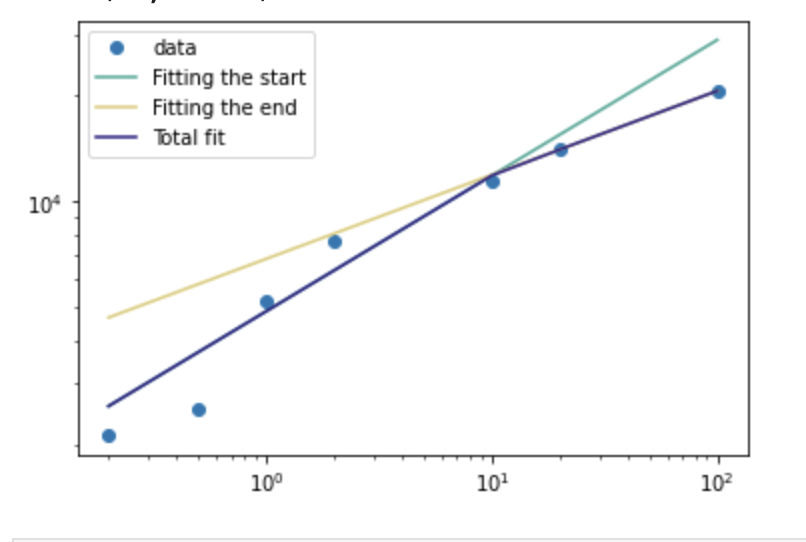
I'm trying to fit a harmonic sum
of 2 power laws on a log-log plot. I'm finding that the first of the two
doesn't really fit the data well at all while the second one is spot
on.
I can't manually choose the cross-over point because
it's not necessarily where my data points are, it could be in between.
I'm finding that the first line seems to really want to fit to the 5th
data point though the only rule I've given it is that for the first data
point the model must fit to that line.
Is
there a way for me to fit the first power law y1 = k1*x^p1
preferentially weighting to the earlier data points? It seems the second
line is doing what I would like with the later ones just fine.
Happy
to elaborate if this isn't clear, the code below should compile. And
I've attached a picture of the fit and fit report too.
Cheers,
Ella
import numpy as np
import lmfit
from lmfit import Model
import matplotlib.pylab as plt
from lmfit import Parameters
# Fitting two linear lines
def two_lin(x, k1, p1, k2, p2):
fit = []
for i in x:
if i < 2:
# It must approach this fit at the start
fit.append(k1*(i)**p1)
elif i > 10:
# And must approach this fit at the end
fit.append(k2*(i)**p2)
else:
# This is a harmonic sum of the two fits that I actually want to fit
fit.append((1/((1/(k1*(i)**p1)))+(1/(k2*(i)**p2)))
return fit
xdata = [0.2, 0.5, 1, 2, 10, 20, 100]
ydata = [2136.316245568918, 2525.427464440836, 5203.690340366244,
7649.548837206918, 11441.27385405904, 14045.49800331112, 20684.82488582436]
# make Model, create parameters, run fit, print results
model = Model(two_lin, nan_policy='propagate')
params = Parameters()
params.add('k1', value=2000, min=0.2)
params.add('p2', value=0.5, min=0.00001)
# This is so that p1 is strictly greater than p2 (the gradients on the final plot)
params.add('delta', value=0.8, min=0.0000001, vary=True)
params.add('p1', expr='delta+p2', min=0.1)
params.add('k2', value=2000, min=0.2)
result = model.fit(ydata, params, x=xdata)
# Get variables
k1 = result.params['k1'].value
p1 = result.params['p1'].value
k2 = result.params['k2'].value
p2 = result.params['p2'].value
plt.xscale('log')
plt.yscale('log')
plt.plot(xdata, ydata, 'o', label='data')
plt.plot(xdata,k1*np.array(xdata)**p1, label='Fitting the start', color='#44AA99')
plt.plot(xdata,k2*np.array(xdata)**p2, label='Fitting the end', color='#DDCC77')
plt.plot(xdata, result.best_fit, 'r-', label='Total fit', color='#332288')
plt.legend()
plt.show()
Reply all
Reply to author
Forward
0 new messages