Evaluate uncertainties for components of composite model
67 views
Skip to first unread message

Jaime Villaseñor
Jan 21, 2022, 2:59:20 PM1/21/22
to lmfi...@googlegroups.com
Hello,
I'm wondering if it's possible to compute the uncertainties for the different components of a composite model with a built-in function similar to what can be done with ModelResult.eval_uncertainty. Alternatively, any directions on how I can compute them myself would be much appreciated.
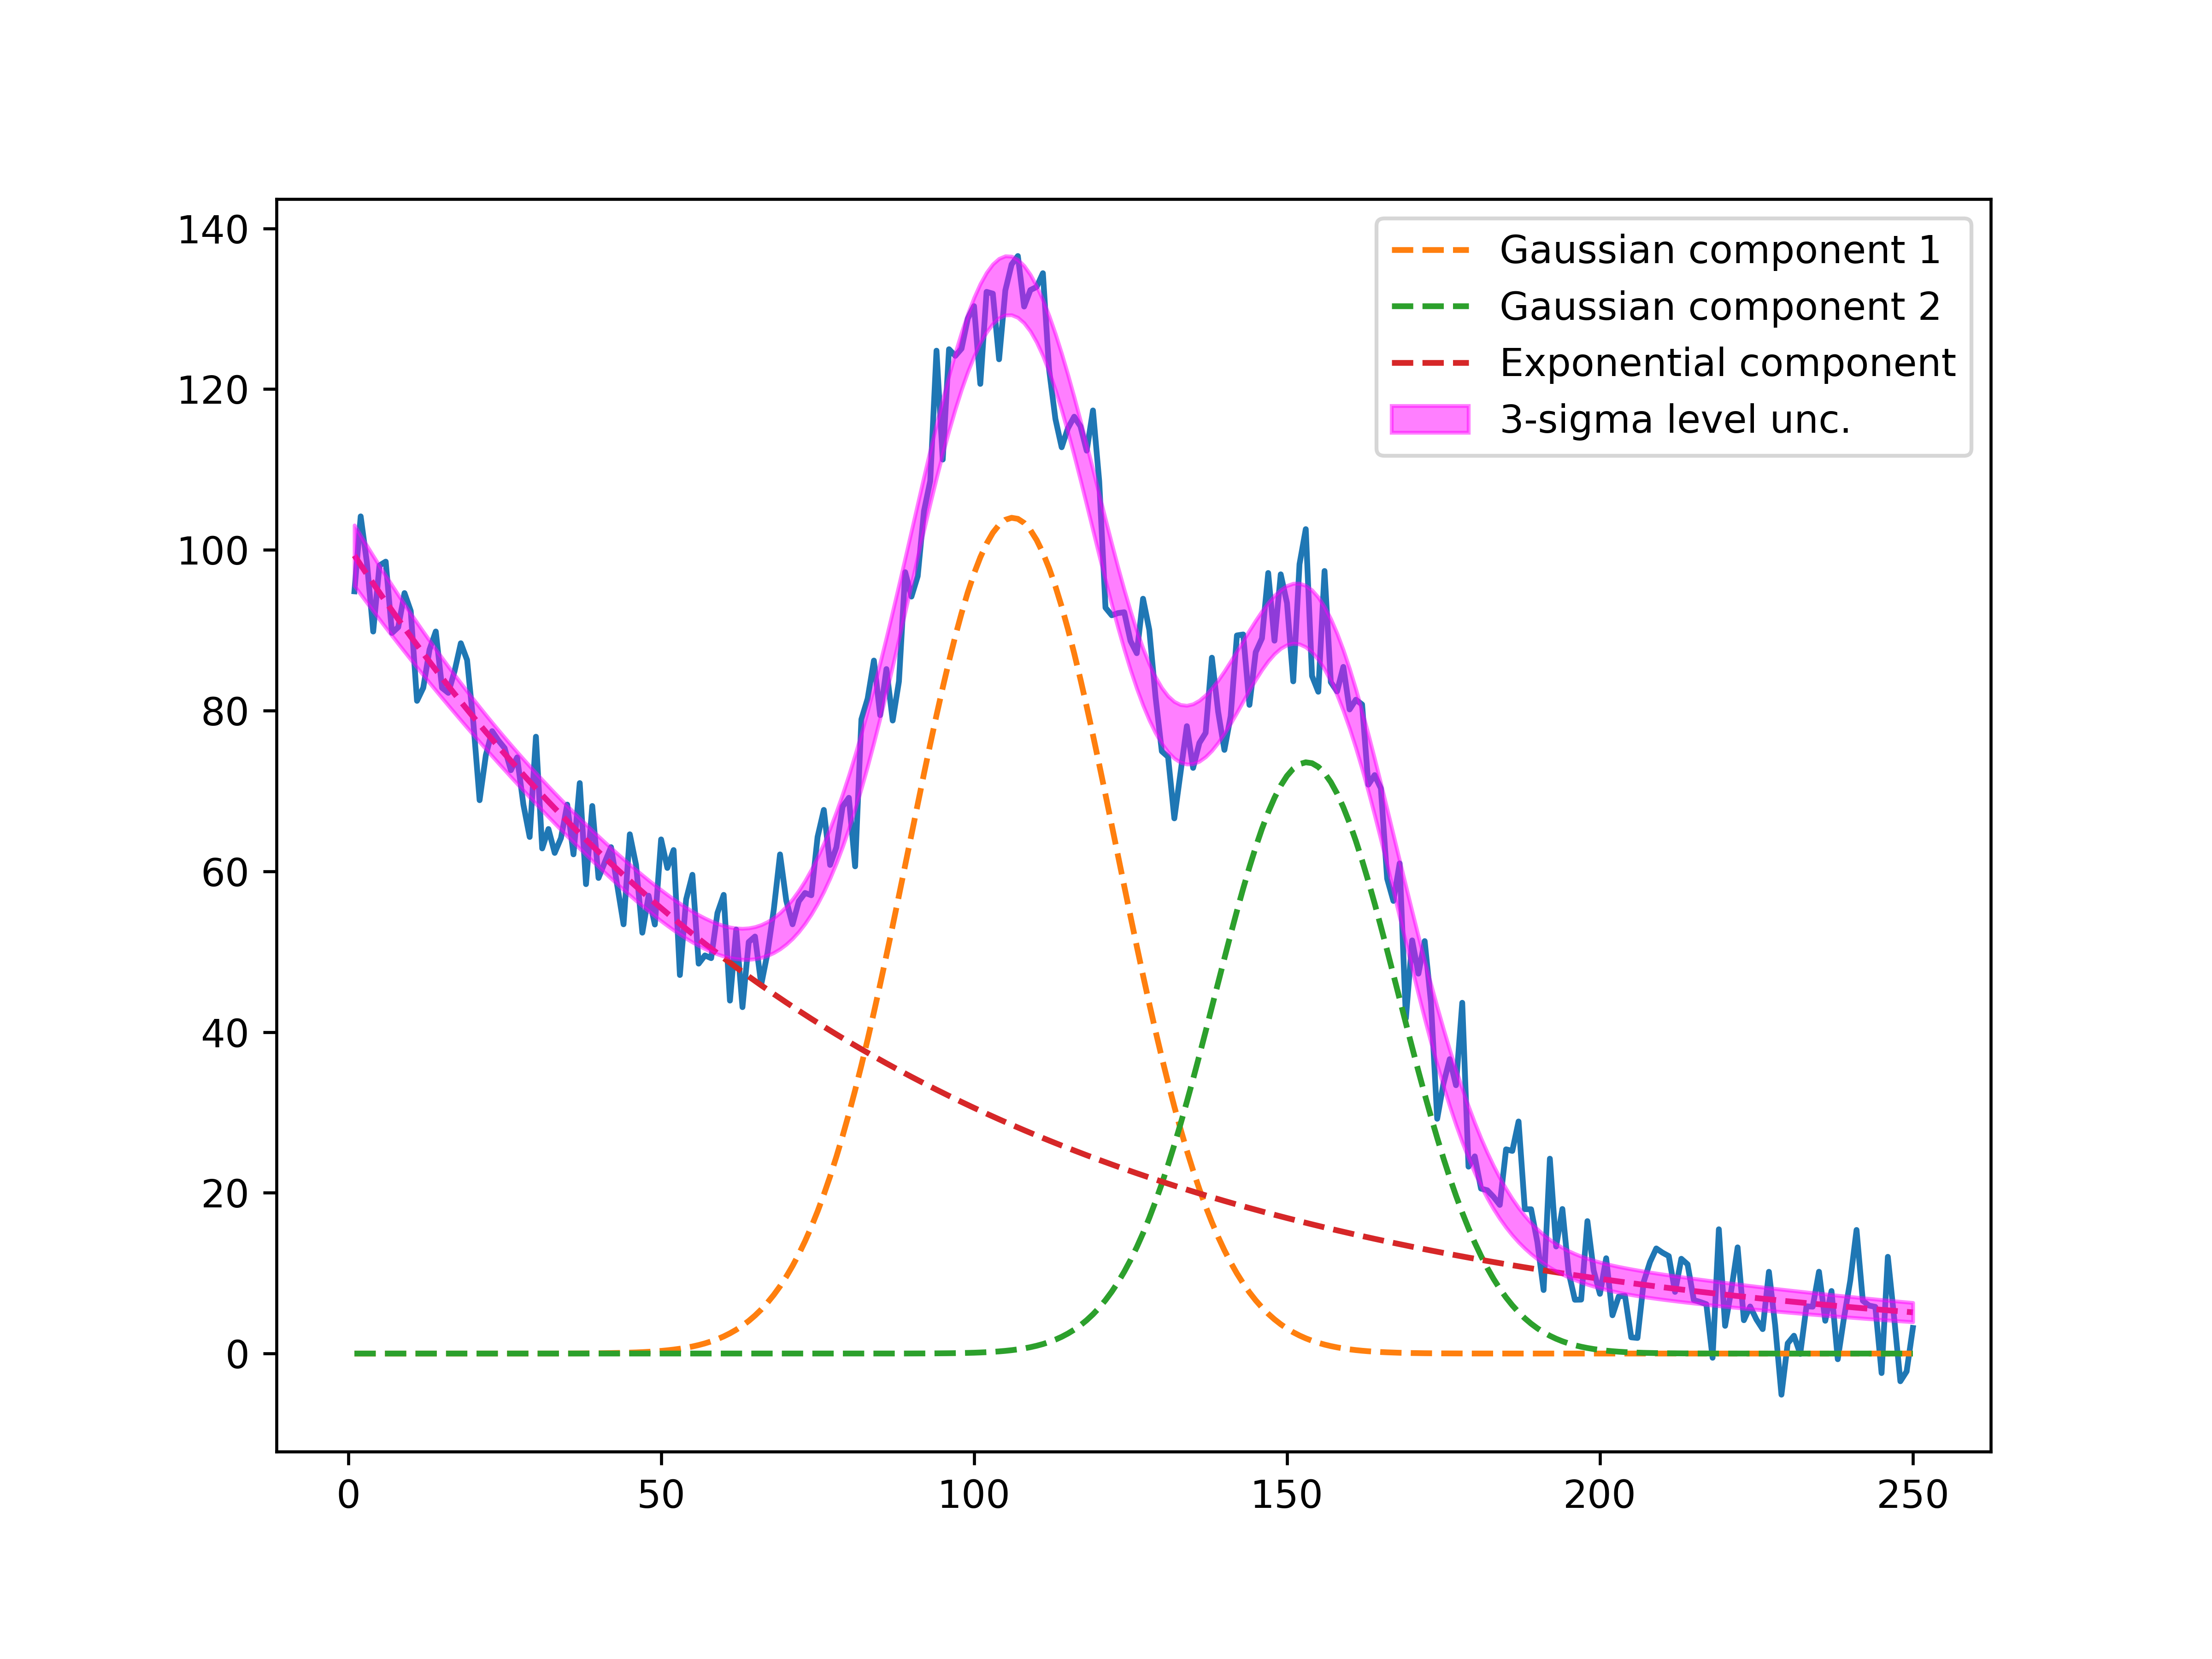
Below is a minimal working example from the "Fitting Multiple Peaks" example in the documentation with the Gauss2 dataset from NIST StRD where I just included extra noise. In this example I'd be interested in the uncertainties of the individual gaussians and exponential models instead of the uncertainties on the composite model (in magenta).
Kind regards,
Jaime
######################################################
import matplotlib.pyplot as plt
import numpy as np
import pandas as pd
from lmfit.models import ExponentialModel, GaussianModel
dat = pd.read_csv('Gauss2.dat', sep='\s+', header=None)
x = dat[1]
yy = dat[0]
# Adding extra noise
rand = np.random.RandomState(10)
noise = np.random.normal(0, 5, 250)
y = yy + noise
exp_mod = ExponentialModel(prefix='exp_')
pars = exp_mod.guess(y, x=x)
gauss1 = GaussianModel(prefix='g1_')
pars.update(gauss1.make_params())
pars['g1_center'].set(value=105, min=75, max=125)
pars['g1_sigma'].set(value=15, min=3)
pars['g1_amplitude'].set(value=2000, min=10)
gauss2 = GaussianModel(prefix='g2_')
pars.update(gauss2.make_params())
pars['g2_center'].set(value=155, min=125, max=175)
pars['g2_sigma'].set(value=15, min=3)
pars['g2_amplitude'].set(value=2000, min=10)
mod = gauss1 + gauss2 + exp_mod
init = mod.eval(pars, x=x)
out = mod.fit(y, pars, x=x)
dely = out.eval_uncertainty(sigma=3)
print(out.fit_report(min_correl=0.5))
comps = out.eval_components(x=x)
fig, ax = plt.subplots(figsize=(8, 6))
ax.plot(x, y)
ax.plot(x, comps['g1_'], '--', label='Gaussian component 1')
ax.plot(x, comps['g2_'], '--', label='Gaussian component 2')
ax.plot(x, comps['exp_'], '--', label='Exponential component')
ax.fill_between(x, out.best_fit+dely, out.best_fit-dely, color='magenta', alpha=0.5, zorder=2, label='3-sigma level unc.')
ax.legend()
plt.show()

Matt Newville
Jan 22, 2022, 4:21:09 PM1/22/22
to lmfit-py
On Fri, Jan 21, 2022 at 1:59 PM Jaime Villaseñor <jaime....@gmail.com> wrote:
Hello,I'm wondering if it's possible to compute the uncertainties for the different components of a composite model with a built-in function similar to what can be done with ModelResult.eval_uncertainty. Alternatively, any directions on how I can compute them myself would be much appreciated.
That's an interesting question and request. Right now, we only calculate the uncertainty in the total, not the individual components.
I agree that this could be valuable, for example, to highlight whether the uncertainty was in "the peak itself" or in "the background".
The calculation is done in "ModelResult.eval_uncertainty" (see https://github.com/lmfit/lmfit-py/blob/master/lmfit/model.py#L1463) which basically constructs the derivatives by hand. I think it would not be too hard to add an option to include the calculation of the per-component-uncertainties and use `self.model.eval_components()` in place of `self.model.eval()` and just doing a bit of bookkeeping.
Would you like to try to make that change?
--Matt

Renee Otten
Jan 23, 2022, 8:59:16 PM1/23/22
to lmfi...@googlegroups.com
This looks like the same request/question as in GitHub Issue 761 (https://github.com/lmfit/lmfit-py/issues/761) - right?
--
You received this message because you are subscribed to the Google Groups "lmfit-py" group.
To unsubscribe from this group and stop receiving emails from it, send an email to lmfit-py+u...@googlegroups.com.
To view this discussion on the web visit https://groups.google.com/d/msgid/lmfit-py/CA%2B7ESboU1oTTWnKBMZ%2BUCDD6sf9bntrhEDgB6WPZ7Nk8WzBK2w%40mail.gmail.com.
Matt Newville
Jan 23, 2022, 10:00:21 PM1/23/22
to lmfit-py
On Sun, Jan 23, 2022 at 7:59 PM Renee Otten <otten...@gmail.com> wrote:
This looks like the same request/question as in GitHub Issue 761 (https://github.com/lmfit/lmfit-py/issues/761) - right?
Yes, or: I think so. But the request seems to be coming from a different person.
Jaime Villaseñor
Jan 24, 2022, 6:21:57 AM1/24/22
to lmfi...@googlegroups.com
Hi Matt,
thanks for your reply. Indeed it seems to be the same request as the one Renee linked, but it didn't come from me.
I'm currently working on this, I'll post a working example here if I can make it work.
Best,
Jaime
--
You received this message because you are subscribed to the Google Groups "lmfit-py" group.
To unsubscribe from this group and stop receiving emails from it, send an email to lmfit-py+u...@googlegroups.com.
To view this discussion on the web visit https://groups.google.com/d/msgid/lmfit-py/CA%2B7ESbqtsrWqFFVfc8zFC2UoJTXt2HLL7W1DEdPMtUsHu1o7FA%40mail.gmail.com.
--
Dr Jaime Villaseñor
Postdoctoral researcher
KU Leuven
Institute of Astronomy
Celestijnenlaan 200D bus 2401
3001 Leuven
Belgium
Postdoctoral researcher
KU Leuven
Institute of Astronomy
Celestijnenlaan 200D bus 2401
3001 Leuven
Belgium
Reply all
Reply to author
Forward
0 new messages