Fitting Peak "Shoulders"
191 views
Skip to first unread message

Oliver Buxton
Nov 5, 2021, 11:18:10 AM11/5/21
to lmfit-py
Hi,
I'm fitting some synchrotron diffraction data which contains data with some low intensity peaks that are very close to others of higher intensity. I've been doing a bit of experimenting with adjusting peak parameters but I'm struggling to get the peaks deconvoluted from each other. Does anybody have any experience with a similar deconvolutions? (I must admit I have only performed a brief search of this mailing list/ stack).
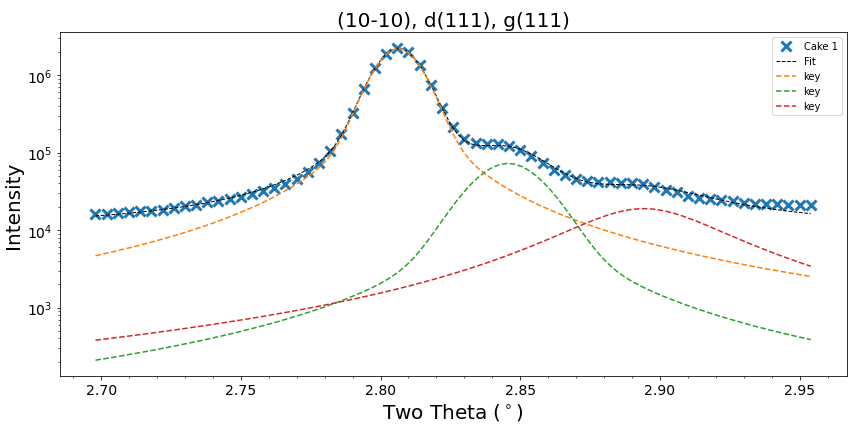
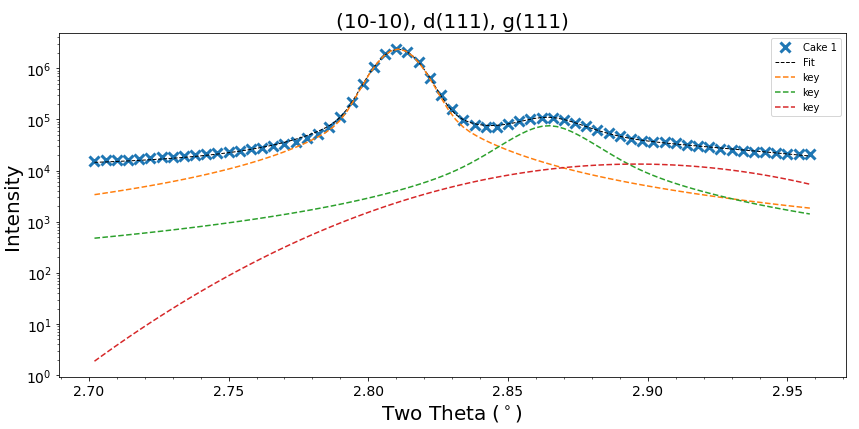
I have attached two images showing a relatively successful fit and a poor fit. They also give an indication of how tricky the "peaks" are to fit. I'll add more information if there is any interest in the post.
Thanks,
Oliver

Renee Otten
Nov 5, 2021, 9:15:08 PM11/5/21
to lmfi...@googlegroups.com
Hi Oliver,
Like we’ve said many times before on the mailing list, providing actual code will often result in more useful answers.The two figures you send don’t help me much at least… why do you consider one “bad” and the other one “relatively successful”? It’s hard to guess what/how you’re trying to do things… For example, are you using our built-in functions and which lineshape, what do you mean by “adjusting peak parameters” (e.g., starting values, boundaries, etcetera)? One thing to consider is if you’re using “our” lineshape functions and/or built-in models is these assume that the baseline is at zero, which isn’t the case here. So if that’s what you’re doing you should certainly include a ConstantModel to account for the offset. What does the “fit_report” tell you, did parameters converge to reasonable values or did they stay close to initial guesses?
Best,
Renee

Matthew Newville
Nov 7, 2021, 11:17:16 AM11/7/21
to lmfit-py
Hi Olivier,
As Renee said, it would be helpful to see actual code and also and explanation of why you consider one of those to be "relatively poor" compared to the other.
> I'm fitting some synchrotron diffraction data which contains data with some low intensity peaks that are very close to others of higher intensity. I've been doing a bit of experimenting with adjusting peak parameters but I'm struggling to get the peaks deconvoluted from each other. Does anybody have any experience with a similar deconvolutions? (I must admit I have only performed a brief search of this mailing list/ stack).
Yes, one of the main use-cases for me is to fit side peaks such as https://xraypy.github.io/xraylarch/_images/XASViewer_prepeaks_fitresult4_plot.png (also from synchrotron data).
For that, I generally start with a model for the very large peak and then use that as a starting point for modeling the weaker peaks. I may start with fixing that "background contribution from the main peak" while adjusting the weaker peaks (trying to decide whether it is 2 or 3 or 4 peaks, maybe setting some bounds on peak centers, and often convincing people that Voigt lineshapes represent these data better than Gaussians). In the end, I much prefer to let all of the parameters (including for the main peak) vary in the fit. I should also say that we know that the main peak is not a single peak, but may consist of several transitions...
Anyway, that's all to say that, yes others do this sort of thing. If you're looking for satellite peaks (other phases, charge density waves, thermal diffuse scattering, etc), I might suggest to first fit that main Bragg peak as well as you can (maybe ignoring the satellite peaks) and then fix that as a background tail and then fit only the region of those weaker satellite peaks, ignoring the main peak. Finally, when you have a decent model, you can allow the parameters for the main peak to adjust (though I would still mostly ignore that main peak).
Finally, if you are showing plots of log of intensity, are you also fitting the log of intensity?
--
You received this message because you are subscribed to the Google Groups "lmfit-py" group.
To unsubscribe from this group and stop receiving emails from it, send an email to lmfit-py+u...@googlegroups.com.
To view this discussion on the web visit https://groups.google.com/d/msgid/lmfit-py/6cf1e424-ca7f-42e2-89e2-99e9dbaa7c03n%40googlegroups.com.
Oliver Buxton
Nov 12, 2021, 11:45:50 AM11/12/21
to lmfit-py
Hi Both
Thanks for your comments, sorry for the delay & sorry I didn't include code earlier on.
I am using a package written by a postdoc for analysis of synchrotron data called xrdfit which you can find here: xrdfit. Within this it uses a PseudoVoigt model to perform the fitting which, if I understand the code correctly, does apply a background although I can't follow how:
def do_pv_fit(peak_data: np.ndarray, maxima_locations: List[Tuple[float, float]], fit_parameters: lmfit.Parameters = None):
"""
Pseudo-Voigt fit to the lattice plane peak intensity.
Return results of the fit as an lmfit class, which contains the fitted parameters
(amplitude, fwhm, etc.) and the fit line calculated using the fit parameters and
100x two-theta points.
"""
model = None
num_maxima = len(maxima_locations)
for maxima_num in range(num_maxima):
# Add the peak to the model
prefix = f"maximum_{maxima_num + 1}_"
if model:
model += lmfit.models.PseudoVoigtModel(prefix=prefix)
else:
model = lmfit.models.PseudoVoigtModel(prefix=prefix)
model.set_param_hint(f"{prefix}snr", expr=f"{prefix}height/background")
model += lmfit.Model(lambda background: background)
two_theta = peak_data[:, 0]
intensity = peak_data[:, 1]
if not fit_parameters:
fit_parameters = model.make_params()
fit_parameters = guess_params(fit_parameters, two_theta, intensity, maxima_locations)
fit_result = model.fit(intensity, fit_parameters, x=two_theta, iter_cb=iteration_callback)
return fit_result
I consider the second plot a poor fit only for the smallest peak (the dotted red line). As the data is physical data it should have a profile reminiscent to the other fits. The large, smooth profile (red dotted line) with tails that don't flatten indicates to me that this is not a good representation of what I expect the data to show.
You comments have already been helpfull to me. I will see if I can achieve a fit as good as yours Matt using the method you describe.
If you do have any other pointers I'm keen to learn!
Thanks,
Oliver
Reply all
Reply to author
Forward
0 new messages