Possible bug in the Damped Harmonic Oscillator function
42 views
Skip to first unread message

Ray Osborn
Sep 28, 2021, 12:49:37 PM9/28/21
to lmfit-py
I don't know if this is too late to get into v1.0.3, but I think there is a bug in the damped harmonic oscillator function in lineshapes.py. At the moment, there is the following lines:
if isinstance(bose, (int, float)):
bose = max(tiny, bose)
else:
bose[where(isnan(bose))] = tiny
bose[where(bose <= tiny)] = tiny
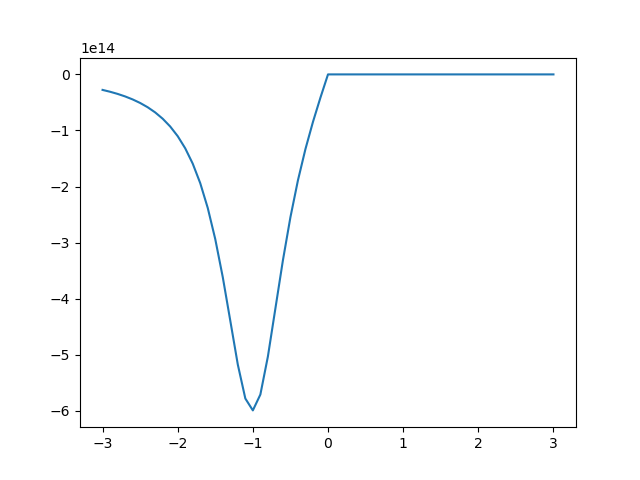
That assumes that bose should always be positive, but in fact it goes negative for energy gain (x<0), so the function gets divided by 'tiny' for all negative values. The fix in the second 'where' statement is to replace 'bose' with 'abs(bose)'. I haven't thought about the first clause yet, but I wanted to write this quickly to see if it's worth submitting a PR for v1.0.3.
I'm guessing not too many neutron scatterers have used this function yet.
Thanks as always for a great package.
Ray Osborn
Sep 28, 2021, 1:27:59 PM9/28/21
to lmfit-py
To make this a little clearer, here is what you get with the default 'dho' function.
>>> from lmfit.lineshapes import dho, tiny
>>> import numpy as np
>>> x=np.linspace(-3,3,61,dtype=float)
>>> plt.plot(x, dho(x, center=1, sigma=0.5))
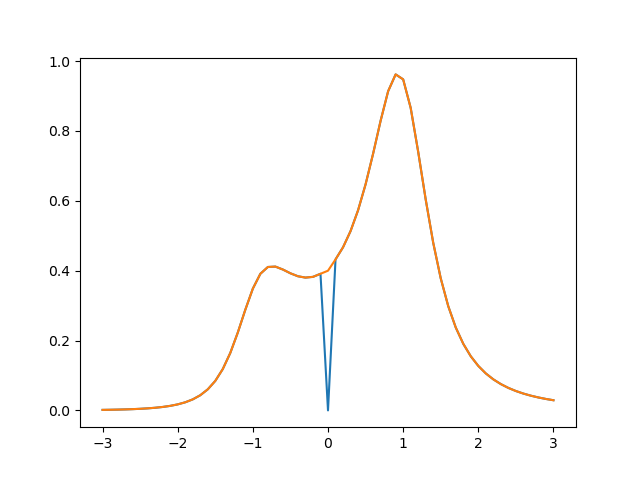
If I make the smallest change (make 'bose' 'np.abs(bose)'), I get the blue curve in the plot below, which is still not ideal when x=0. To improve on that, you would have to make 'bose=gamma' when x=0 (orange curve).
I got the orange curve with the following function:
def newer_dho(x, amplitude=1., center=0., sigma=1., gamma=1.0):
tiny = 1.0e-15
bose = (1.0 - np.exp(-x/max(tiny, gamma)))
if isinstance(bose, (int, float)):
bose = max(tiny, bose)
else:
bose[np.where(np.isnan(bose))] = tiny
bose[np.where(np.isclose(x, 0.0))] = gamma
lm = 1.0/((x-center)**2 + sigma**2)
lp = 1.0/((x+center)**2 + sigma**2)
return np.where(np.isclose(x, 0.0), amplitude*lm*sigma/gamma, amplitude*sigma/np.pi*(lm - lp)/bose)
That would be my preferred solution.
I will wait for comments before submitting a PR.
Ray

Mark Dean
Sep 28, 2021, 1:40:55 PM9/28/21
to lmfi...@googlegroups.com
Thanks Ray.
I think your revision fails if x is an integer or float.
--
You received this message because you are subscribed to the Google Groups "lmfit-py" group.
To unsubscribe from this group and stop receiving emails from it, send an email to lmfit-py+u...@googlegroups.com.
To view this discussion on the web visit https://groups.google.com/d/msgid/lmfit-py/bc61296c-fb4a-41d9-9bcb-4f2b5ac02123n%40googlegroups.com.
--------------------------------------------
Mark P. M. Dean
Brookhaven National Laboratory
Condensed Matter Physics Bldg 734
Upton NY 11973
USA
Phone: 001 631 344 7847
Email: md...@bnl.gov
Ray Osborn
Sep 28, 2021, 2:13:14 PM9/28/21
to lmfit-py
Hi Mark,
Thanks - I admit I haven't tested it comprehensively. I rushed this out to see if I can catch the 1.0.3 release, but I'm not surprised it needs to be made more robust.
The same issue with the x=0 limit also applies to the thermal_distribution function. In NeXpy, I created a separate BoseFactorModel, which calculates x*Bose(x) so that it can be used to multiply other models, such as the LorentzianModel to model quasielastic scattering that obeys detailed balance even at x=0. This was the first time I had checked out the DHO function.
Ray

Renee Otten
Sep 28, 2021, 2:52:18 PM9/28/21
to lmfi...@googlegroups.com
Hi Ray, Mark,
For sure, we should fix the issue with the line shape before the next release. Honestly I don’t really know how this line shape is supposed to behave, but clearly what we do know and the result you show is quite different ;) And I am sure that you actually do know these line shapes, so thank you for pointing this out!
To retain the sign of the value one can use the “not_zero” function as we do in some of the other line shape functions as well; but I realize that’s not really the (only) issue here. So yes, please do send a PR with a fix and, as Mark said, the improved function should still work with a float/integer x-value as well.
Thanks!
Renee
To view this discussion on the web visit https://groups.google.com/d/msgid/lmfit-py/69b8e345-6bd5-4760-8aed-03f45924577fn%40googlegroups.com.

Matt Newville
Sep 28, 2021, 3:18:53 PM9/28/21
to lmfit-py
Hi Ray, Mark, Renee,
Thanks, and yes let's fix this for the next release! I'll try to look at how to best fix this, but suggestions are welcome!
To view this discussion on the web visit https://groups.google.com/d/msgid/lmfit-py/0309E5FC-988C-484F-B8D1-F0B1EFCF9B12%40gmail.com.
Message has been deleted
Ray Osborn
Sep 29, 2021, 9:57:02 AM9/29/21
to 'Thomas Bersano' via lmfit-py
I have branch in my lmfit fork that contains a fix for this, and I’m happy to submit it as a PR if people want. After finally doing the math, it turns out that the asymptotic form of the function at x=0 is 4*gamma*center/(center**2+sigma**2)**2. I have tested this under a number of conditions and it appears to be robust. My version also works for scalar values of x.
The only issue is when center=0. The overall function is then identically 0 at all x. In my branch, I set the default value of center to 1 and the minimum value to 0, since the function is automatically antisymmetric apart from the bose factor. I guess that means that it could pass smoothly through zero without causing a problem. I don’t know if you have a policy for such cases.
Do you prefer having a Github issue opened first, or is this discussion enough?
Ray
P.S. This is an abbreviated version of a message that I thought I had submitted to the mailing list yesterday. I couldn’t find it this morning but I apologize if this duplicates any previous information.
To view this discussion on the web visit https://groups.google.com/d/msgid/lmfit-py/CA%2B7ESbrZ6UgzF%2BrgdRdZMRRTDQx3s70jM9ARdjBgzxrpe%3D4ohA%40mail.gmail.com.
Matt Newville
Sep 29, 2021, 10:30:35 AM9/29/21
to lmfit-py
Hi Ray,
Sorry, somehow your earlier message got labeled "pending" and the notice for that was flagged by a spam filter.
A PR for this with a more robust form would be great. I looked at this too and started taking a different approach: looking for that `x=0` condition which causes `bose` to be zero, and so causing a divide-by-zero. I think maybe we could just look for that (`where is bose too close to 0`) and then replace that value of the DHO result by the average of the +1 and -1 values. That avoids the spike, but sort of requires some added error checking (for: only one value near zero? end-point handling?) but I think it is solvable.
And if Renee agrees, I think we can probably do this and merge the other recent PRs by the beginning of next week.
To view this discussion on the web visit https://groups.google.com/d/msgid/lmfit-py/257EF537-1FA2-4517-9A19-466BD2C394E6%40gmail.com.
Matt Newville
Sep 29, 2021, 10:52:50 AM9/29/21
to lmfit-py
Hi Ray,
Thanks, yes that looks good to me!
On Wed, Sep 29, 2021 at 9:51 AM Ray Osborn <rayne...@gmail.com> wrote:
I finally worked through the math, and I think the following form for the dho function has the right asymptotic values at zero energy. I think it also works for scalar values of x.def dho(x, amplitude=1., center=0., sigma=1., gamma=1.0):
factor = amplitude * sigma / pi
bose = (1.0 - exp(-x/max(tiny, gamma)))
if isinstance(bose, (int, float)):
bose = not_zero(bose)
else:
bose[where(isnan(bose))] = tiny
bose[where(abs(bose)<=tiny)] = tiny
lm = 1.0/((x-center)**2 + sigma**2)
lp = 1.0/((x+center)**2 + sigma**2)
return factor * where(isclose(x, 0.0),
4*gamma*center/(center**2+sigma**2)**2,
(lm - lp)/bose)Ray
To view this discussion on the web visit https://groups.google.com/d/msgid/lmfit-py/0c8d844f-319d-4836-8986-4eeab23d4188n%40googlegroups.com.
Reply all
Reply to author
Forward
0 new messages