Is there a possibility to compare two estimation methods in SEM with simsem package?

Monika Ramoskaite

Terrence Jorgensen
Is there such possibility with simsem package or any posibility to compare estimators?

Alex Schoemann
Monika Ramoskaite
raw <- sim(1000, n=nrow(data), model = fit, dataOnly=TRUE)
output <- sim(model = parTable(fit), rawData=raw)
--
You received this message because you are subscribed to the Google Groups "lavaan" group.
To unsubscribe from this group and stop receiving emails from it, send an email to lavaan+un...@googlegroups.com.
To view this discussion on the web visit https://groups.google.com/d/msgid/lavaan/948b6292-d3e8-411a-8266-b1695ae71402%40googlegroups.com.
Terrence Jorgensen
I'll add that you probably want to fit the models using each estimator to the same data sets if possible.
To do this, run your code (for one condition) using sim() with dataOnly = TRUE, this will give you a list of data frames you can then fit models to this data by using the rawData option in sim()
Alex Schoemann
Terrence Jorgensen
As I understand, then it is enough to write sim() as it was: sim(1000, data=nrow(data), model=fit), as seed argument is set by default.
You also mention generate= argument, which I believe if not specified is set by default with model= argument?
Therefore if I run the below simulation two times (for each estimator):
fit <- sem(FullModel, data=data, std.lv=TRUE, estimator="ML")
output <- sim(1000, n=nrow(data), model = parTable(fit))I should receive the output I am looking for, or should I specify generate argument afterall?
I have a model with mediation effect. When I run it with lavaan, sem() function, ML estimate, I get, quite good results
All parameter estimates are also significant, including mediation effect (also tested with bootstrap, to get CI).
However when I run simulation with simsem with sem() function
I get poor results, poor model-fit indices cut-off values (e.g. CFI=0, RMSEA>0.3), and the pValue() function shows that all simulations showed worse results than analysis from observed data. In addition, strangely, andRule value (the number of replications that have all fit indices indicating a better model than the observed data) is equal 1, which I suppose contradicts the other results?
What does it mean?
set.seed(1234)
X <- rnorm(100)
M <- 0.5*X + rnorm(100)
Y <- 0.7*M + rnorm(100)
Data <- data.frame(X = X, Y = Y, M = M)
model <- ' # direct effect
             Y ~ c*X
           # mediator
             M ~ a*X
             Y ~ b*M
           # indirect effect (a*b)
             ab := a*b
           # total effect
             total := c + (a*b)
         '
fit <- sem(model, data = Data)
summary(fit)
output <- sim(10, n=nrow(Data), model = fit)
summary(output)Also, when I try to apply DWLS estimator in simsem, although it runs well when modelling in lavaan
Monika Ramoskaite
You mean using the sim() function, with sem() output as the model= argument?
You were looking at the same indices, but with DWLS, you need to look at the scaled statistic ("chisq.scaled","rmsea.scaled", etc.).
Also, I'm not sure if anything went right because you are only providing some excerpts of syntax and output that confused you. Are you using the ordered= argument to tell lavaan that which variables are ordinal, or are you only setting estimator = "DWLS"?
Also, what is your goal in comparing estimators? It is unclear whether you want to generate ordinal data regardless, then see what happens when you treat them as ordinal (with DWLS) or as continuous (with ML).
Terrence Jorgensen
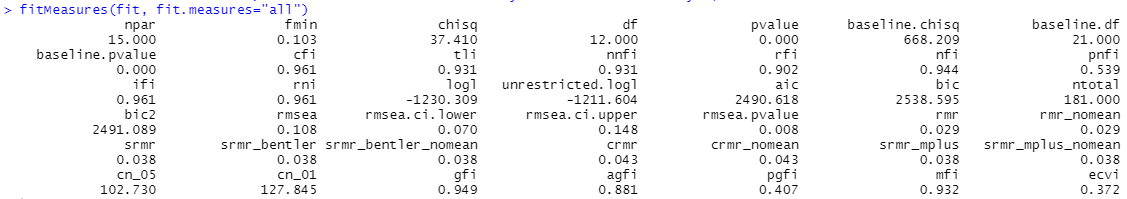
You were looking at the same indices, but with DWLS, you need to look at the scaled statistic ("chisq.scaled","rmsea.scaled", etc.).Are these available in lavaan? In the list of fitMeasures I could not find these:
I am doing an empirical study.
fit.ml <- sem(..., estimator = "MLR") # all your cited studies compared DWLS to robust ML
fit.dwls <- sem(..., ordered = ...) # DWLS will be chosen automatically
out.ml <- sim(..., model = fit.ml, generate = fit.dwls)
out.dwls <- sim(..., model = fit.dwls, generate = fit.dwls)Terrence Jorgensen
fit.ml <- sem(..., estimator = "MLR") # all your cited studies compared DWLS to robust ML
fit.dwls <- sem(..., ordered = ..., conditional.x = FALSE) # DWLS will be chosen automatically
out.ml <- sim(..., model = fit.ml, generate = fit.dwls, estimator = "MLR")
out.dwls <- sim(..., model = fit.dwls, generate = fit.dwls,
ordered = ..., conditional.x = FALSE)Monika Ramoskaite
You were looking at the same indices, but with DWLS, you need to look at the scaled statistic ("chisq.scaled","rmsea.scaled", etc.).Are these available in lavaan? In the list of fitMeasures I could not find these:
Because you were not declaring any variables as ordered=, so DWLS was not actually used.
fit.ml <- sem(..., estimator = "MLR") # all your cited studies compared DWLS to robust ML
fit.dwls <- sem(..., ordered = ...) # DWLS will be chosen automatically
out.ml <- sim(..., model = fit.ml, generate = fit.dwls)
out.dwls <- sim(..., model = fit.dwls, generate = fit.dwls)Sorry, quick addendum. I think the error is caused by the default setting of conditional.x = TRUE when estimator = "DWLS".
fit.dwls <- sem(..., ordered = ..., conditional.x = FALSE) # DWLS will be chosen automatically
out.ml <- sim(..., model = fit.ml, generate = fit.dwls, estimator = "MLR")
out.dwls <- sim(..., model = fit.dwls, generate = fit.dwls,
ordered = ..., conditional.x = FALSE)


jpma...@gmail.com
Hi Monica and Terrance,
… I am kind of working on a similar problem… here is what I’ve learned so far (I am using this data for an academic evaluation):

My question now is a little different: What happens if you have normative population but your sample is strongly biased (say, respondents always give high scores because of social pressure or intervier effect)?
Will be glad to share thoughts …
Best,
João Marôco
--
You received this message because you are subscribed to the Google Groups "lavaan" group.
To unsubscribe from this group and stop receiving emails from it, send an email to lavaan+un...@googlegroups.com.
To view this discussion on the web visit https://groups.google.com/d/msgid/lavaan/CAG7qNkgcVxFAEFmkKOB9j4VXna%3D-px0KwgCwTZ4Bpmjt1Znwaw%40mail.gmail.com.
Terrence Jorgensen
What happens if you have normative population but your sample is strongly biased (say, respondents always give high scores because of social pressure or intervier effect)?
Terrence Jorgensen
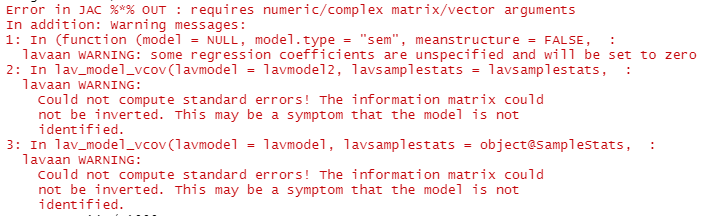
I did include ordered= (as per your comment), scaled statictics were not included after declaring the ordered variables. However it seems that the scaled statistics are not shown if I use both arguments ordered= and estimator="DWLS". Removing estimator="DWLS" and only keeping ordered= solved the problem and scaled statistics became visible.
what might be the reason?
parTable(fit.MLR)If I set generate=fit.mlr for both estimators instead of fit.dwls, the output.dwls does not converge
jpma...@gmail.com
Hi Terrence,
Thanks for your comments.
So, yes, assume that your population is normative and have a nice normal distribution, but then you just sample the clinical sub-population from the overall population.
For example, say that you want to measure depression with the Beck Depression Inventory and you correctly expect that your item distributions are like this for the normative population:
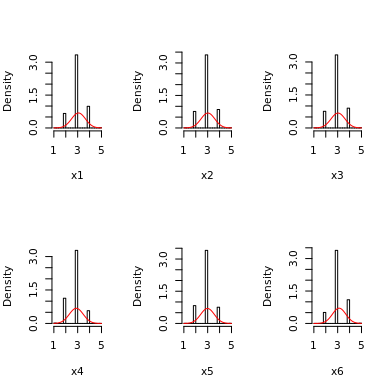
But then, you extract a sample that is composed of patients with major depression. All items will have quite skewed to the right responses, something like this:
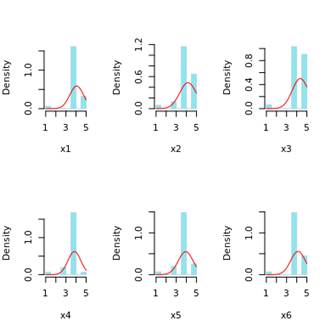
(I just changed colors to make simulations visualization less boring)
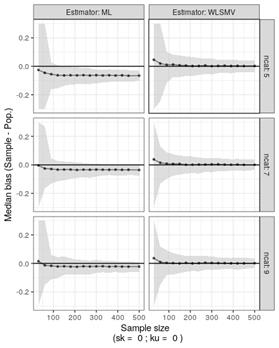
What kind of (wrong) estimation will you get for factor loadings from WLSMV or ML?
I know that WLSMV assumes that the latents are normal and ML assumes that the items are MVN… But, I see people (students, but not only) doing CFA all the time with this skewed data, and I believe that WLSMV overestimates the true loadings and ML may underestimate the true factor loadings… but I can not give definitive answers other than “if your items do not have sensitivity then the measure can’t be valid whatever results you got from CFA”…
Cool, ah😊
Best,
João Marôco
From: lav...@googlegroups.com <lav...@googlegroups.com> On Behalf Of Terrence Jorgensen
Sent: 29 de novembro de 2019 15:03
To: lavaan <lav...@googlegroups.com>
Subject: Re: Is there a possibility to compare two estimation methods in SEM with simsem package?
What happens if you have normative population but your sample is strongly biased (say, respondents always give high scores because of social pressure or intervier effect)?
--
You received this message because you are subscribed to the Google Groups "lavaan" group.
To unsubscribe from this group and stop receiving emails from it, send an email to lavaan+un...@googlegroups.com.
To view this discussion on the web visit https://groups.google.com/d/msgid/lavaan/ceeca56f-7b0d-4037-8cec-b2b7f81f4796%40googlegroups.com.
Monika Ramoskaite
output <- sim(1000, n=nrow(data), model = parTable(fit))
I have a model with mediation effect. When I run it with lavaan, sem() function, ML estimate, I get, quite good results, keeping in mind slightly non-normal data (attributing to higher chi-sq and it's significant p-value):

All parameter estimates are also significant, including mediation effect (also tested with bootstrap, to get CI).
However when I run simulation with simsem with sem() function, I get poor results, poor model-fit indices cut-off values (e.g. CFI=0, RMSEA>0.3), and the pValue() function shows that all simulations showed worse results than analysis from observed data. In addition, strangely, andRule value (the number of replications that have all fit indices indicating a better model than the observed data) is equal 1, which I suppose contradicts the other results?
What does it mean?
Also, when I try to apply DWLS estimator in simsem, although it runs well when modelling in lavaan

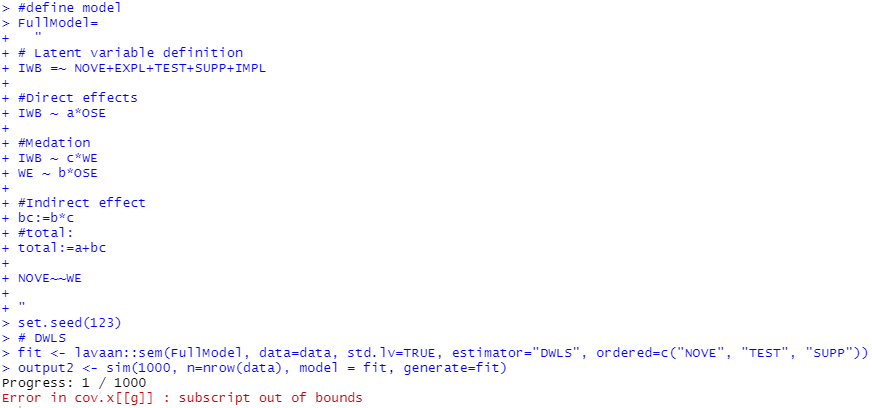
when I run simulations, I receive error:

Thank you both for replies.As I understand, then it is enough to write sim() as it was: sim(1000, data=nrow(data), model=fit), as seed argument is set by default. You also mention generate= argument, which I believe if not specified is set by default with model= argument? Therefore if I run the below simulation two times (for each estimator):
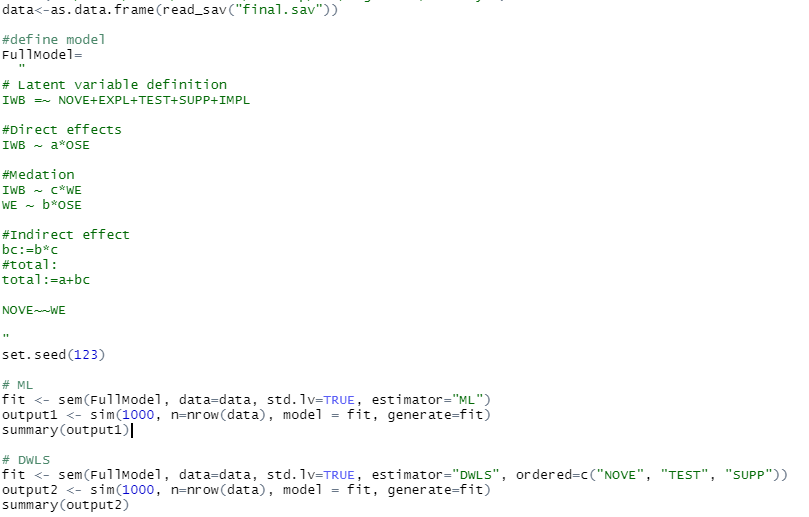
fit <- sem(FullModel, data=data, std.lv=TRUE, estimator="ML")
output <- sim(1000, n=nrow(data), model = parTable(fit))
I shoud receive the output I am looking for, or should I specify generate argument afterall?However, when I run the above functions, I receive the result, that I find confusing.I have a model with mediation effect. When I run it with lavaan, sem() function, ML estimate, I get, quite good results, keeping in mind slightly non-normal data (attributing to higher chi-sq and it's significant p-value):
All parameter estimates are also significant, including mediation effect (also tested with bootstrap, to get CI).
However when I run simulation with simsem with sem() function, I get poor results, poor model-fit indices cut-off values (e.g. CFI=0, RMSEA>0.3), and the pValue() function shows that all simulations showed worse results than analysis from observed data. In addition, strangely, andRule value (the number of replications that have all fit indices indicating a better model than the observed data) is equal 1, which I suppose contradicts the other results?
What does it mean?
Also, when I try to apply DWLS estimator in simsem, although it runs well when modelling in lavaan
when I run simulations, I receive the error:
What would be the way to remedy this?Apologies for so many questions, but I feel slightly confused. Appreciate all the help.
--
You received this message because you are subscribed to the Google Groups "lavaan" group.
To unsubscribe from this group and stop receiving emails from it, send an email to lavaan+un...@googlegroups.com.
To view this discussion on the web visit https://groups.google.com/d/msgid/lavaan/e3bf07cc-b0a9-441b-9eca-e86385494594%40googlegroups.com.
Monika Ramoskaite
output <- sim(1000, n=nrow(data), model = parTable(fit))
I have a model with mediation effect. When I run it with lavaan, sem() function, ML estimate, I get, quite good results, keeping in mind slightly non-normal data (attributing to higher chi-sq and it's significant p-value):
All parameter estimates are also significant, including mediation effect (also tested with bootstrap, to get CI).
However when I run simulation with simsem with sem() function, I get poor results, poor model-fit indices cut-off values (e.g. CFI=0, RMSEA>0.3), and the pValue() function shows that all simulations showed worse results than analysis from observed data. In addition, strangely, andRule value (the number of replications that have all fit indices indicating a better model than the observed data) is equal 1, which I suppose contradicts the other results?
What does it mean?
Also, when I try to apply DWLS estimator in simsem, although it runs well when modelling in lavaan
when I run simulations, I receive the error:
Monika Ramoskaite
I have a model with mediation effect. When I run it with lavaan ML estimate I get, quite good results, keeping in mind slightly non-normal data (attributing to higher chi-sq and it's significant p-value):
All parameter estimates are also significant, including mediation effect (also tested with bootstrap, to get CI).
However when I run simulation with simsem with sem() function, I get poor results, terrible model-fit indices cut-off values (e.g. CFI=0, RMSEA>0.3), and the pValue() function shows that all simulations showed worse results than analysis from observed data. However, andRule value (the number of replications that have all fit indices indicating a better model than the observed data) is equal 1, which I suppose contradicts the other results?
What does it mean?
Also, when I try to apply DWLS estimator in simsem, although it runs well when modelling in lavaan

when I run simulations, I receive error:

--
You received this message because you are subscribed to the Google Groups "lavaan" group.
To unsubscribe from this group and stop receiving emails from it, send an email to lavaan+un...@googlegroups.com.
To view this discussion on the web visit https://groups.google.com/d/msgid/lavaan/e3ee7104-1f07-4e20-8ce8-32c156de1d52%40googlegroups.com.
Monika Ramoskaite
I have a model with mediation effect. When I run it with lavaan ML estimate I get, quite good results, keeping in mind slightly non-normal data (attributing to higher chi-sq and it's significant p-value):
All parameter estimates are also significant, including mediation effect (also tested with bootstrap, to get CI).
However when I run simulation with simsem with sem() function, I get poor results, terrible model-fit indices cut-off values (e.g. CFI=0, RMSEA>0.3), and the pValue() function shows that all simulations showed worse results than analysis from observed data. However, andRule value (the number of replications that have all fit indices indicating a better model than the observed data) is equal 1, which I suppose contradicts the other results?
What does it mean?
Also, when I try to apply DWLS estimator in simsem, although it runs well when modelling in lavaan

when I run simulations, I receive error:
Monika Ramoskaite
Also @Terrence Jorgensen,
I have a model with mediation effect. When I run it with lavaan ML estimate I get, quite good results, keeping in mind slightly non-normal data (attributing to higher chi-sq and it's significant p-value):
All parameter estimates are also significant, including mediation effect (also tested with bootstrap, to get CI).
However when I run simulation with simsem with sem() function, I get poor results, terrible model-fit indices cut-off values (e.g. CFI=0, RMSEA>0.3), and the pValue() function shows that all simulations showed worse results than analysis from observed data. However, andRule value (the number of replications that have all fit indices indicating a better model than the observed data) is equal 1, which I suppose contradicts the other results?
![enter image description here]()
What does it mean?
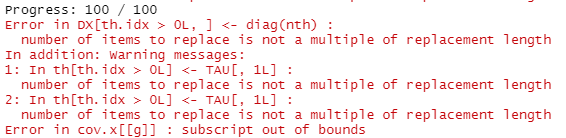
Also, when I try to apply DWLS estimator in simsem, although it runs well when modelling in lavaan
when I run simulations, I receive error:
How do I remedy?
To view this discussion on the web visit https://groups.google.com/d/msgid/lavaan/53f6a9b1-890e-4f52-9cfd-9d46ceff4b77%40googlegroups.com.
Monika Ramoskaite
Monika Ramoskaite

Terrence Jorgensen
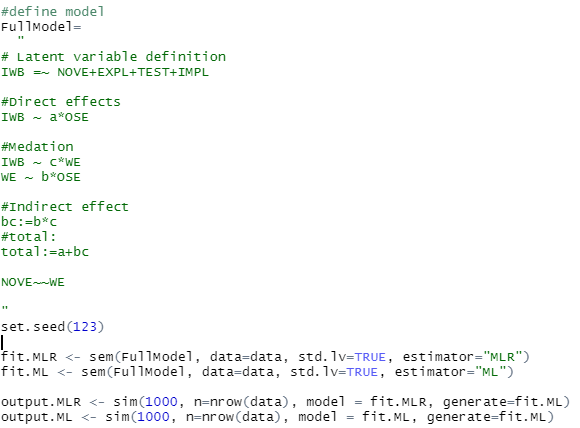
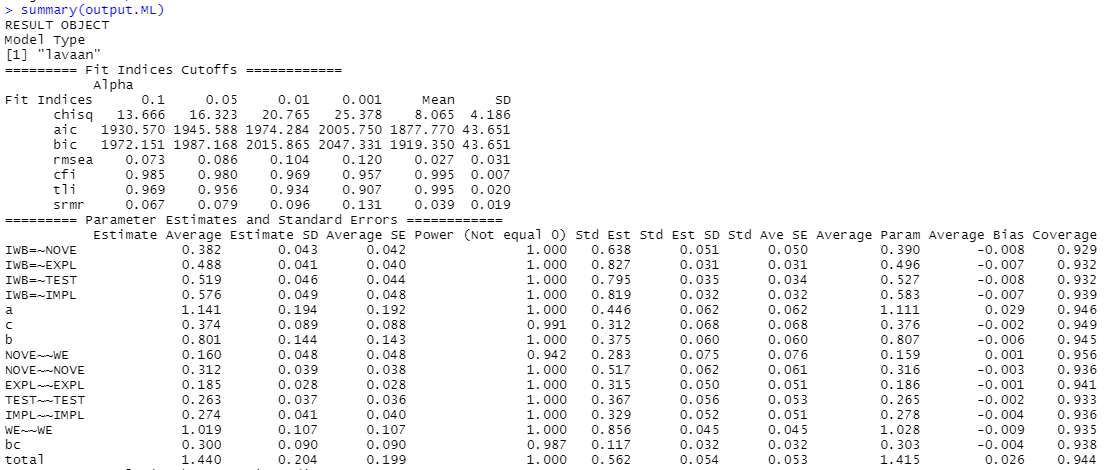
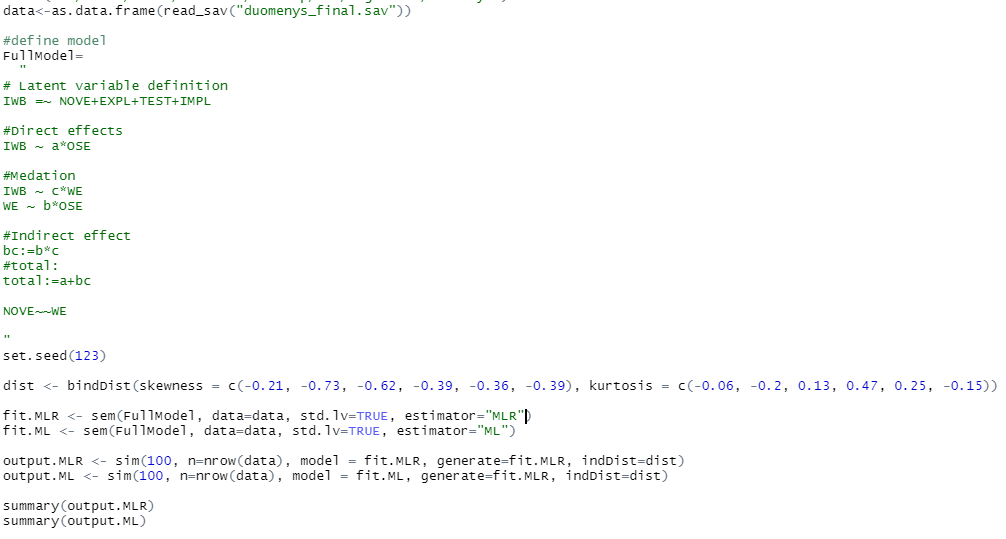
I am still trying to compare different estimators with simsem package.This time ML and MLRThe results after running sim() come identical for both, however I believe this should not be the case
the data does have fair to moderate skew and kurtosis.
Monika Ramoskaite
--
You received this message because you are subscribed to the Google Groups "lavaan" group.
To unsubscribe from this group and stop receiving emails from it, send an email to lavaan+un...@googlegroups.com.
To view this discussion on the web visit https://groups.google.com/d/msgid/lavaan/cd579d55-8d82-4830-9b6e-9d7bc8d9d28d%40googlegroups.com.
Terrence Jorgensen
but not the case with sim()
Monika Ramoskaite
--
You received this message because you are subscribed to the Google Groups "lavaan" group.
To unsubscribe from this group and stop receiving emails from it, send an email to lavaan+un...@googlegroups.com.
To view this discussion on the web visit https://groups.google.com/d/msgid/lavaan/dd8aa2e1-4c99-49ac-a545-e4e3c5c2f858%40googlegroups.com.