Moderated mediation (path analysis): interpretation indirect effect and plotting interaction effect
842 views
Skip to first unread message

Sarah
Sep 11, 2018, 10:41:32 AM9/11/18
to lavaan
Hi everyone,
C4, C5a, C5b: dummy control variable
I conducted a path analysis including moderated mediation. The model has 2 independent variables, 1 moderator (leading to several interaction effects), 1 mediator and 1 DV:

X1: continuous independent
X2: continuous independent
Mo: dummy moderator
Me: continuous mediator
Y: continuous dependent
C1-C3: continuous control variableMo: dummy moderator
Me: continuous mediator
Y: continuous dependent
C4, C5a, C5b: dummy control variable
Dashed lines: effects coming from control variables
Indirect effect
Usually, in a mediation model with 1 independent variable, the indirect effect is reported by a*b (parameters in accordance to the example above).
But given that this model contains 2 independent variables and a moderator, I wonder how I can correctly specify the indirect effect.
I have for instance tried the specifications below:
indX1 := b*(a1)
indX2 := b*(a2)
indX1_mod := b*(a1+e1)
indX2_mod := b*(a2+e2)
1a. Could you advise me on how to specify the indirect effects in the aforementioned example please?
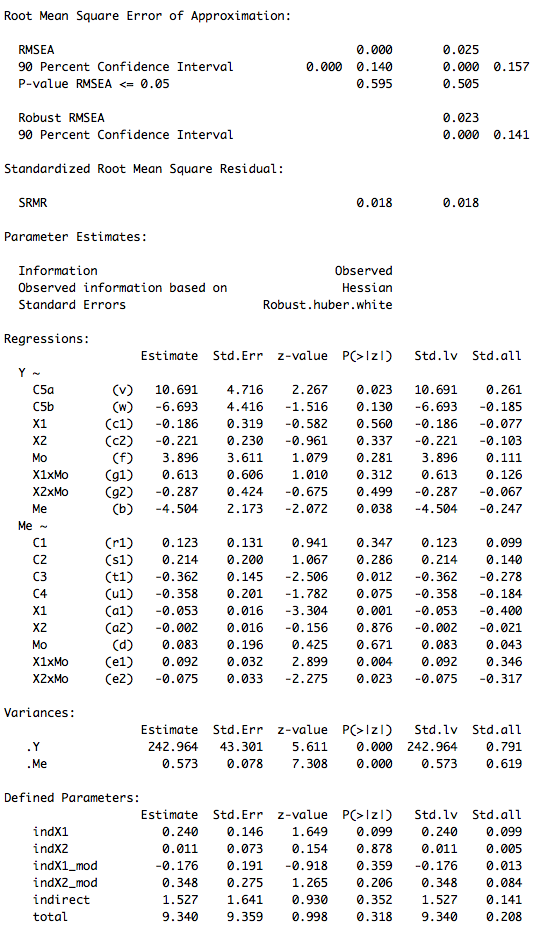
1b. In the output that I obtained in R (cfr bottom of this post), there is a significant effect from Me to Y (b), and a significant effect from X1 to Me (a1), and a significant interaction effect e1.
Yet, the indirect effect specified as b*(a1) or b*(a1+e1) is not significant. Assuming that either b*(a1) or b*(a1+e1) is correct to represent the indirect effect, what could be the reason for the insignificance of the indirect effect? And does this undermine the "mediating story", or can I base myself on the regression coefficients and their corresponding p-values to justify my story?
Plotting interaction effect
When researchers execute a linear regression model with an interaction effect, it seems common practice to plot that interaction effect.
It would be interesting if I could visualise the model's interaction effects as below (graphs are based on linear model investigating the effect of X1 and X2 on Me, conditional on Mo):
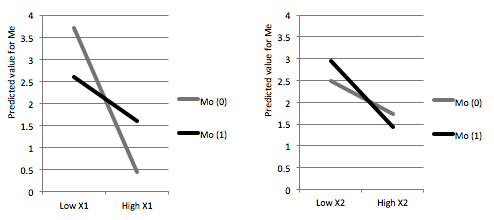
2a. Is it appropriate to plot an interaction effect coming from a sem model?
2b. If yes, how could I retrieve the necessary information from the model to establish these graphs?
I tried filling in the regression Me ~ r1*C1 + s1*C2 + t1*C3 + u1*C4 + a1*X1 + a2*X2 + d*Mo + e1*X1xMo + e2*X2xMo, but I'm not convinced that this was correct.
For example: for low X1 and Mo=1, I calculated Me ~ r1*0 + s1*0 + t1*0 + u1*0 + a1*(averageX1-2*SD) + a2*0 + d*1 + e1*(averageX1-2*SD)*1 + e2*0
But the resulting score for Me seems of a weird magnitude to me. I notice that the regression does not include an intercept (no idea if there is one and if so, where to find it), which is different from a "normal" linear regression. Not sure if this would clarify the strange outcome, and how to solve this issue?
Thanks in advance for the help,
Sarah
Output:
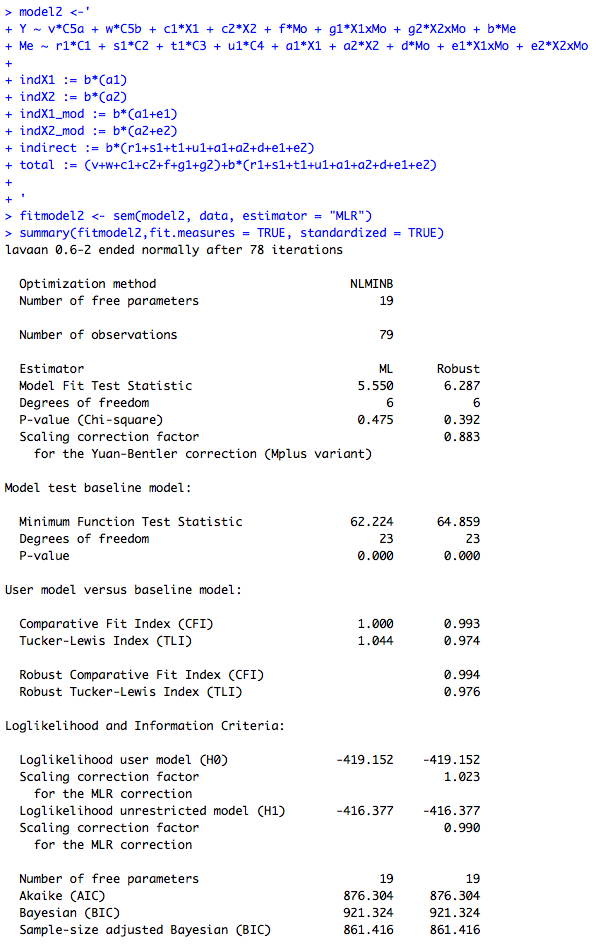
Note: I used estimator = "MLR" to account for multivariate non-normality

Terrence Jorgensen
Sep 12, 2018, 5:53:30 PM9/12/18
to lavaan
1a. Could you advise me on how to specify the indirect effects in the aforementioned example please?
1b. In the output that I obtained in R (cfr bottom of this post), there is a significant effect from Me to Y (b), and a significant effect from X1 to Me (a1), and a significant interaction effect e1.Yet, the indirect effect specified as b*(a1) or b*(a1+e1) is not significant. Assuming that either b*(a1) or b*(a1+e1) is correct to represent the indirect effect, what could be the reason for the insignificance of the indirect effect?
b*(a1+e1) is only testing the indirect effect when the moderator == 1 (see the link above). Regardless, products of parameters have even more sampling variance than the parameters themselves, so their NHST results are not a simple combination of decisions from the NHSTs of their direct effects.
2a. Is it appropriate to plot an interaction effect coming from a sem model?
SEM is just a bunch of regressions, so any method used for regression models can be applied to any of the regression models in an SEM.
2b. If yes, how could I retrieve the necessary information from the model to establish these graphs?
Well, you only have observed variables, so you should get equivalent point estimates from fitting individual regression models using the lm() function. Then you can use the same method you used to generate the plots you posted.
Terrence D. Jorgensen
Postdoctoral Researcher, Methods and Statistics
Research Institute for Child Development and Education, the University of Amsterdam
Sarah
Sep 13, 2018, 3:31:50 AM9/13/18
to lavaan
Dear Dr. Jorgensen,
Op woensdag 12 september 2018 23:53:30 UTC+2 schreef Terrence Jorgensen:
Thank you so much for the advice, helps a lot!
Have a great day,
Sarah
Op woensdag 12 september 2018 23:53:30 UTC+2 schreef Terrence Jorgensen:
Reply all
Reply to author
Forward
0 new messages