Skip to first unread message

simon taylor
Jun 20, 2019, 8:09:30 AM6/20/19
to lavaan
Hi all,
I've just recently come to grips with lavaan so I am aware that there is a lot that I still have to learn. Essentially, I am doing a 2-level sem and trying to get some input on whether my input is correct or not. The coach data, alongside 2 of the 3 athlete variables are nonnormal (skewed to the left). I have followed the syntax recommendations from Rosseel (2018), however, I have been unable to find a syntax online which provides me with exact instructions on how to deal with nonnormal data. The only way I am able to get output for the majority of my data is when I do optim.method="em", otherwise the majority of the between output is NA. I know that my sample size isn't that big (157 athletes, 39 coaches), however, as I am interested in elite level sports and have been collecting data for 9 months and need to stop now as I need to move on to the next study. I appreciate that my questions might be somewhat vague, but as there is no one who can really help me with my data, I am hoping you might be able to save me.
Thank you in advance for your help!
My input is the following:
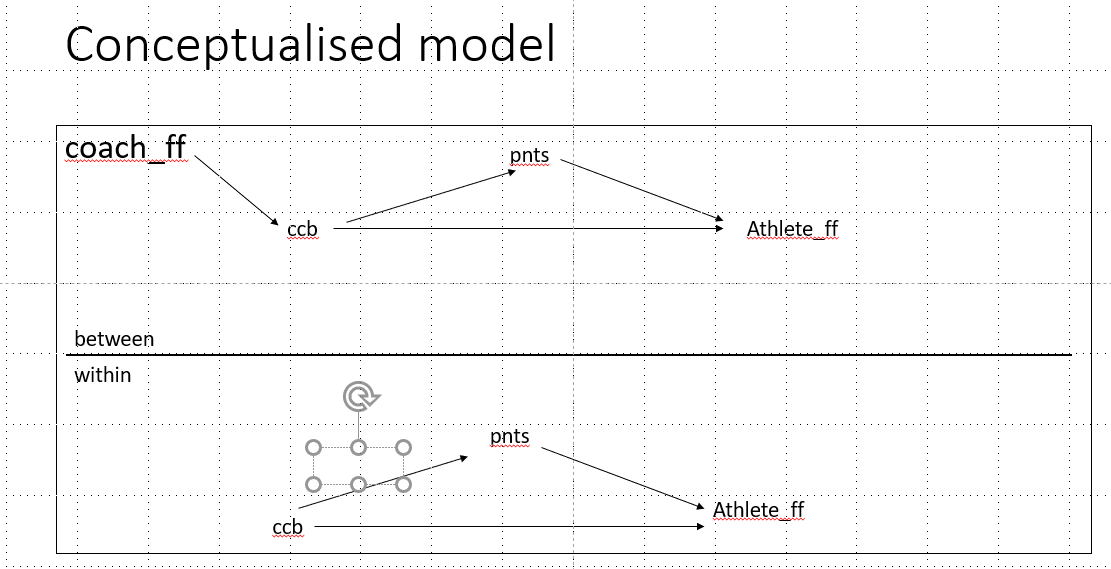
#calculate level 2 model with coach FF as explanatory variable
mlm <- 'level: within
athlete_ff ~wc*ccb + wb*pnts
pnts ~ wa*ccb
level: between
ccb~coach_ff
athlete_ff ~ bc*ccb + bb*pnts
pnts ~ ba*ccb
ccb~coach_ff
athlete_ff ~ bc*ccb + bb*pnts
pnts ~ ba*ccb
#correlation
athlete_ff~~pnts
athlete_ff~~ccb
athlete_ff~~coach_ff
pnts~~ccb
pnts~~coach_ff
ccb~~coach_ff
athlete_ff~~ccb
athlete_ff~~coach_ff
pnts~~ccb
pnts~~coach_ff
ccb~~coach_ff
#defined parameters
wi := wa * wb
bi := ba * bb
'
wi := wa * wb
bi := ba * bb
'
fit4 <- sem(mlm, data = Rdata_complete, cluster = "team",optim.method= "em", std. lv=TRUE)
summary(fit4)

Terrence Jorgensen
Jun 20, 2019, 3:42:42 PM6/20/19
to lavaan
You really shouldn't be running an MLSEM; even the L1 model has a low N, and L2 is obscenely low. You can't trust results based on asymptotic theory so far from the asymptote. But to account for nonnormality, you could set estimator = "MLR".
Looking at your model, your only strictly Level-2 variable is the exogenous predictor coach_ff. So you could run separate multilevel regression models with lmer() in the lme4 package, then use the mediate package to estimate and test indirect effects (it will use Bayesian or bootstrap methods to calculate the CI, which are perfectly acceptable).
Terrence D. Jorgensen
Assistant Professor, Methods and Statistics
Research Institute for Child Development and Education, the University of Amsterdam
simon taylor
Jun 20, 2019, 4:21:43 PM6/20/19
to lavaan
Thank you for your feedback, I really appreciate it! I knew my sample size was small, but I've seen papers published in my field that have around the same numbers, however, they might have used different programs. I used your advice regarding the estimator="MLR" and reduced the amount of correlations and the output has improved in terms of providing me with more data, however, the biggest issue is that it says degrees of freedom=-1 I know I'm asking a lot, but I was hoping you might be able to take a quick look at the improved input and the output and see whether it looks any better now.
#calculate level 2 model with coach FF as explanatory variable
mlm <- 'level: within
athlete_ff ~wc*ccb + wb*pnts
pnts ~ wa*ccb
level: between
ccb~coach_ff
athlete_ff ~ bc*ccb + bb*pnts
pnts ~ ba*ccb
ccb~coach_ff
athlete_ff ~ bc*ccb + bb*pnts
pnts ~ ba*ccb
#correlation
athlete_ff~~pnts
athlete_ff~~ccb
pnts~~ccb
ccb~~coach_ff
athlete_ff~~ccb
pnts~~ccb
ccb~~coach_ff
#defined parameters
wi := wa * wb
bi := ba * bb
'
wi := wa * wb
bi := ba * bb
'
fit4 <- sem(mlm, data = Rdata_complete, cluster = "team",optim.method= "em", estimator= "MLR", std.lv=TRUE)
summary(fit4)
summary(fit4)
lavaan 0.6-3 ended normally after 5398 iterations

  Optimization method                               EM
  Number of free parameters                         22

                                                  Used       Total
  Number of observations                           151         157
  Number of clusters [team]                         38

  Estimator                                         ML      Robust
  Model Fit Test Statistic                          NA          NA
  Degrees of freedom                                -1          -1
  Scaling correction factor
    for the Yuan-Bentler correction (Mplus variant)

Parameter Estimates:

  Information                                 Observed
  Observed information based on                Hessian
  Standard Errors                   Robust.huber.white


Level 1 [within]:

Regressions:
                   Estimate  Std.Err  z-value  P(>|z|)
  athlete_ff ~
    ccb       (wc)   -0.030    0.078   -0.387    0.699
    pnts      (wb)    0.300    0.067    4.471    0.000
  pnts ~
    ccb       (wa)    0.665    0.092    7.254    0.000

Intercepts:
                   Estimate  Std.Err  z-value  P(>|z|)
   .athlete_ff        0.000
   .pnts              0.000
   .ccb               0.000

Variances:
                   Estimate  Std.Err  z-value  P(>|z|)
   .athlete_ff        0.542    0.076    7.124    0.000
   .pnts              0.847    0.095    8.947    0.000
   .ccb               0.952    0.167    5.707    0.000


Level 2 [team]:

Regressions:
                   Estimate  Std.Err  z-value  P(>|z|)
  ccb ~
    coach_ff          0.007    0.089    0.078    0.938
  athlete_ff ~
    ccb       (bc)   -0.764    0.504   -1.517    0.129
    pnts      (bb)    0.674    0.436    1.545    0.122
  pnts ~
    ccb       (ba)   -0.824    6.449   -0.128    0.898

Covariances:
                   Estimate  Std.Err  z-value  P(>|z|)
 .athlete_ff ~~
   .pnts              0.287    1.542    0.186    0.852
   .ccb               0.209    0.170    1.229    0.219
 .pnts ~~
   .ccb               0.382    1.827    0.209    0.834
 .ccb ~~
    coach_ff          0.011    0.003    4.053    0.000

Intercepts:
                   Estimate  Std.Err  z-value  P(>|z|)
   .ccb               2.655    0.119   22.293    0.000
   .athlete_ff       -0.023    1.731   -0.013    0.989
   .pnts              4.847   17.172    0.282    0.778
    coach_ff         -0.579    0.129   -4.500    0.000

Variances:
                   Estimate  Std.Err  z-value  P(>|z|)
   .ccb               0.281    0.149    1.883    0.060
   .athlete_ff        0.155    0.331    0.469    0.639
   .pnts              0.558    4.980    0.112    0.911
    coach_ff          0.629    0.108    5.838    0.000

Defined Parameters:
                   Estimate  Std.Err  z-value  P(>|z|)
    wi                0.199    0.055    3.600    0.000
    bi               -0.555    4.300   -0.129    0.897
Is there a way to improve the df, or do I have to scrap the idea of using lavaan and use another method, such as lmer? I have tried the mediate package with lmer () and while it offers direct/indirect effects, the CI's are all 0 and for the p-value it just says NA.
Best regards,
Simon
Terrence Jorgensen
Jun 21, 2019, 10:29:59 AM6/21/19
to lavaan
it says degrees of freedom=-1
You need to delete the correlations. You are estimating the same bivariate relationship as both a slope and a correlation, which is redundant unless you make other restrictive assumptions.
simon taylor
Jun 26, 2019, 11:00:14 AM6/26/19
to lavaan
Hi Terrence,
Thank you for your reply and apologies for the late response. I have spent some time trying to understand how to use lmer and mediation package, but there seems to be less documentation out there in comparison to lavaan. Also, I am unable to figure out how to deal with my skewed data. Do you have any sources or information you might be able to provide me with, which might help?
Best regards,
Simon
Reply all
Reply to author
Forward
0 new messages