2 options, which one is the good one ?
194 views
Skip to first unread message

Sacha Varin
Sep 13, 2022, 4:25:02 PM9/13/22
to lavaan
Dear lavaan R experts,
Good afternoon,
I write to you for 1 question and a R request.
I have 7 variables. One of them (X_7) is simply the mean of the 6 others (X_1 ; X_2 ; X_3 ; X_4 ; X_5 ; X_6). There is determinism in my data.
Fitting à SEM model, I hesitate between these 2 options.
Either
X_7 is a latent variable, which is estimated, not calculated as the mean of the others. To be able to assess a mean for this variable, one of the (unstandardized) loadings of the other variables on X_7 is fixed to 1 (per default it is the first). The other loadings are then estimated and the latent variable gets the same unit as the variable that has the fixed loading. So fitting a SEM on this data with X_7 as latent variable.
Or I would use the effects-coded method of scaling (Little, TD, Slegers, DW & Card NA, (2006). A non-arbitrary method of identifying and scaling latent variables on SEM and MACS models. Structural equation modeling, 13(1), 59-72.)
X1 = 6 - x2 - x3 - x4 - x5 -x6; The mean of latent factor would be the mean of the items ?
Which option is the good One and How to code my SEM model using lavaan R package ?
Best,
Sacha VARIN

Terrence Jorgensen
Sep 14, 2022, 8:15:59 AM9/14/22
to lavaan
One of them (X_7) is simply the mean of the 6 others (X_1 ; X_2 ; X_3 ; X_4 ; X_5 ; X_6). There is determinism in my data.
Why do you want a model that has both? What inference/hypothesis are you trying to draw/test?
X1 = 6 - x2 - x3 - x4 - x5 -x6; The mean of latent factor would be the mean of the items ?
If you have complete data, then the factor mean would be the same as the mean of a scale composite calculated by averaging the items.
Which option is the good One
Again, good to do what?
How to code my SEM model using lavaan R package ?
See the effect.coding= argument in the ?lavOptions help page for automated effects coding.
Terrence D. Jorgensen
Assistant Professor, Methods and Statistics
Research Institute for Child Development and Education, the University of Amsterdam
Sacha Varin
Sep 14, 2022, 9:03:53 AM9/14/22
to lavaan
Dear Terrence,
Really appreciate your answer. I have to explain why I want to fit a SEM model on my data.
I have learned a DAG and I am trying now to estimate effects. In my opinion I can use a SEM to estimate a DAG but it requires me to correctly specify the functional form of each relationship.
Terrence Jorgensen
Sep 16, 2022, 5:44:12 AM9/16/22
to lavaan
In my opinion I can use a SEM to estimate a DAG
SEM can be used for some DAGs, but not if the variables are collinear.
Sacha Varin
Sep 20, 2022, 5:06:12 PM9/20/22
to lavaan
Dear Terrence,
Best
Yes, thanks for your response. Multicollinearity is a data problem. I use VIF and all VIFs are lower than 3, so collinearity should not be an issue.
Best

Paul Joseph
Sep 20, 2022, 5:43:30 PM9/20/22
to lav...@googlegroups.com
I greet you well, my question might be trivia. Can I use time series data for SEM especially path analysis. If yes, do I need to text for stationarity? Really need your help
Show quoted text
--
You received this message because you are subscribed to the Google Groups "lavaan" group.
To unsubscribe from this group and stop receiving emails from it, send an email to lavaan+un...@googlegroups.com.
To view this discussion on the web visit https://groups.google.com/d/msgid/lavaan/64907fa3-0250-4e4c-bf38-8dad9cac8ac4n%40googlegroups.com.
Sacha Varin
Oct 23, 2022, 4:50:07 PM10/23/22
to lavaan
Dear lavaan experts,
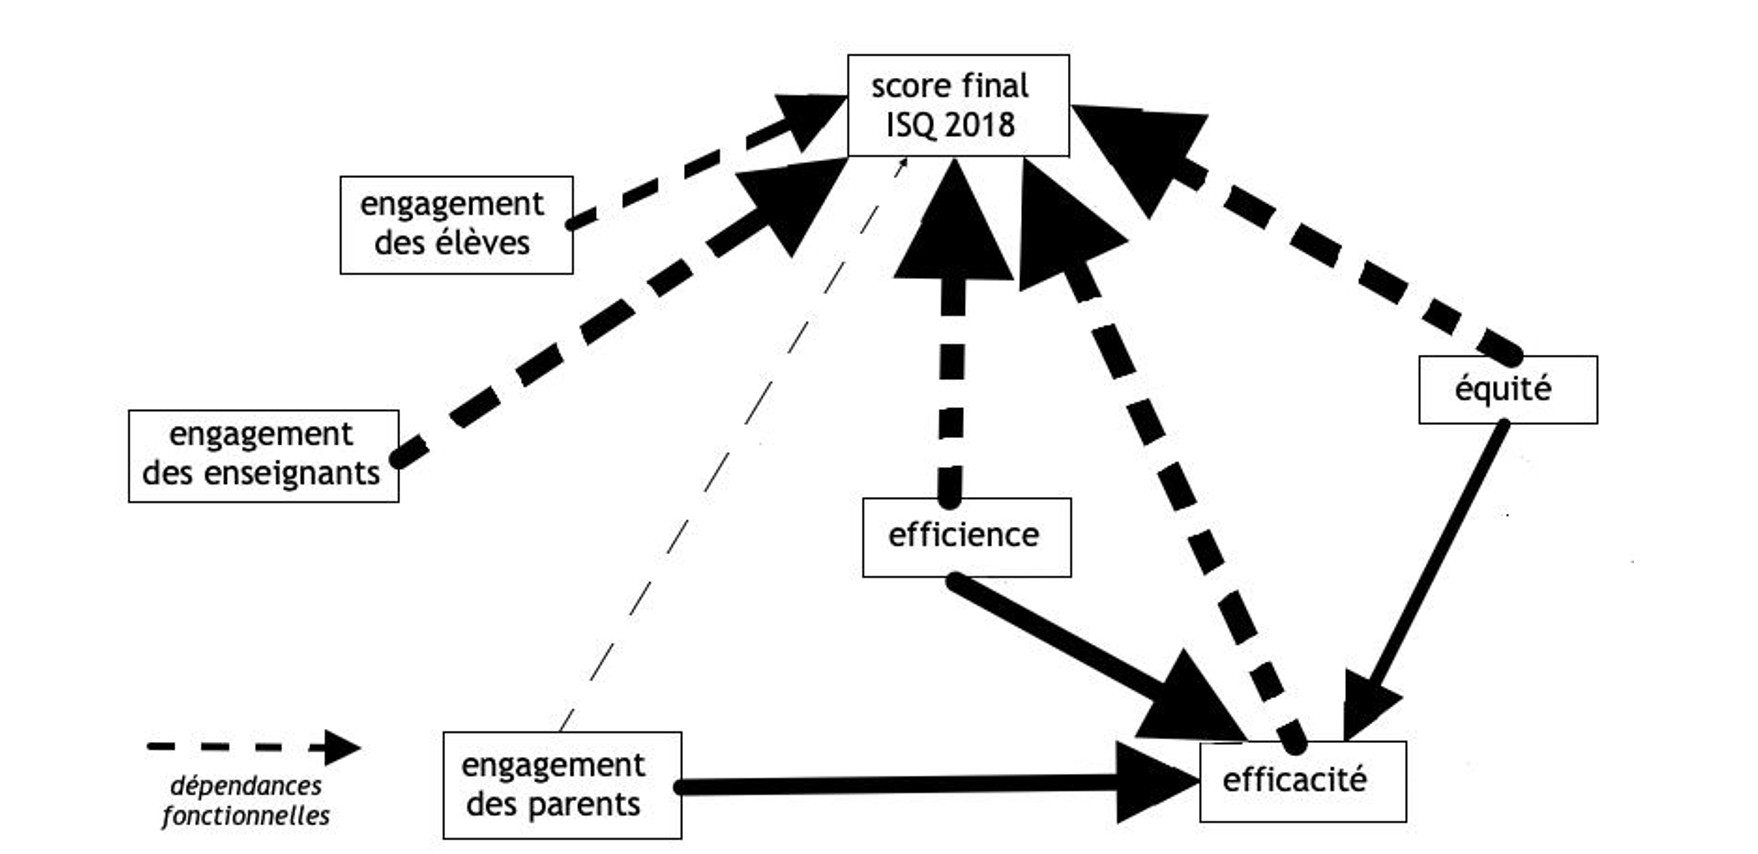
In attached file the DAG I get. Some edges (- - - ->) are functional dependencies and the other (---->) are probabilistic dependencies.
"Score final ISQ 2018" is a latent variable, which is estimated, not calculated as the mean of the others
I have never used lavaan. I was wondering if the R code here below was good according to my DAG as I am trying to estimate effects ?
#####################
library(lavaan)
model <- '
# measurement model
Engag des élèves =~ score final ISQ 2018
Engag des enseignants =~ score final ISQ 2018
Engagement des parents =~ score final ISQ 2018
Efficience =~ score final ISQ 2018
Efficacité =~ score final ISQ 2018
Équité =~ score final ISQ 2018
# regressions
Efficacité ~ équité
Efficacité ~ engagement des parents
Efficience ~ efficacité
'
fit <-sem(model, data=data)
summary(fit, standardized = TRUE)
##################
Reply all
Reply to author
Forward
0 new messages