What does it mean when the Correlation between Slope and Intercept in a latent growth curve model is <1?

Randy Stache
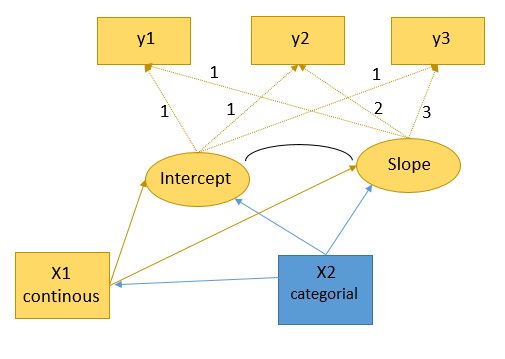
Int =~ 1*y1 + 1*y2 + 1*y3
Slo =~ 1*y1 + 2*y2 + 3*y3
Int ~~ Slo
Int ~ X1 + country_2 # with country_1 as reference category)
Slo ~ X1 + country_2
X1 ~ country_2
X1 ~ 1
'
fit <- growth(mod, data = data, estimator='ML',
missing = "FIML", group = 'sex')
The following Warning turns up at the end of the estimation:
"Warning message:In lav_start_check_cov(lavpartable = lavpartable, start = START) : lavaan WARNING: starting values imply a correlation larger than 1; variables involved are: Int Slo [in block 2]"
After first checkings, it turns out, that the problem of the correlation >1 between Intercept and Slope occurs only in a certain group (male) within country_2. If I omit either the regression of the intercept or the regression of the slope to the country variable, the multigroup model runs perfectly. Model fits are always very good (CFI>0.97) but the slopes are low and insignificant - so there seems to be no change over time. However, a LR test indicated that a random-intercept-random-slope model is significantly better than just a random-intercept-fixed slope model.
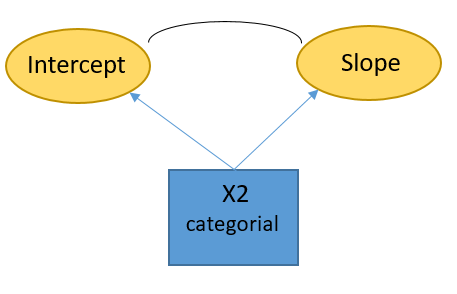
Now my Question is: What does it mean, when in a certain group the correlation between Intercept and Slope is estimated >1 as soon as a certain conditional variable is considered? Is this a problem of multicollinearity? It seems to me, that the whole issue is located in the following section of the model:
Let me know if you need further information. I would be very grateful for your help.
Best Wishes
Randy

Mauricio Garnier-Villarreal
Int =~ 1*y1 + 1*y2 + 1*y3
Int ~~ Slo
Slo ~ X1 + country_2
X1 ~ country_2
Randy Stache
Int =~ 1*y1 + 1*y2 + 1*y3
Int =~ 1*y1 + 1*y2 + 1*y3
Slo =~ 0*y1 + 1*y2 + 2*y3
Mauricio Garnier-Villarreal
Randy Stache
| male female | Total
-----------+-------------------------+------------
EN | 48 122 | 170
GE | 296 795 | 1,091
SW | 90 199 | 289
-----------+--------------------------+---------
Total | 434 1,116 | 1,550
There really seem to be relatively few cases for certain combinations, but calculations seem to me to be possible in principle.
Mauricio Garnier-Villarreal

Patrick (Malone Quantitative)
--
You received this message because you are subscribed to the Google Groups "lavaan" group.
To unsubscribe from this group and stop receiving emails from it, send an email to lavaan+un...@googlegroups.com.
To view this discussion on the web visit https://groups.google.com/d/msgid/lavaan/12c3dcdb-9934-4954-b7be-228608ca6a81n%40googlegroups.com.
--
NEW Service Models: http://malonequantitative.com
He/Him/His
Mauricio Garnier-Villarreal
Patrick (Malone Quantitative)
To view this discussion on the web visit https://groups.google.com/d/msgid/lavaan/0fd8d7b0-fcaf-4052-8a34-3a60bd3422e8n%40googlegroups.com.