Can't solve this error message : "The smallest eigenvalue of the EM estimated variance-covariance matrix (Sigma) is smaller than 1e-05;"
1,041 views
Skip to first unread message

Solène Frileux
Sep 5, 2022, 9:55:30 AM9/5/22
to lavaan
Dear all,
I am trying to elaborate a model with 8 latent variables. I am using zscores, from a neurocognitive set, with test results that were taken by some patients.
One of the latent variable is a sum of differences :
a= b-c
d= e-f
g= h-i
j= k-l
And the latent variable is defined as follows : ' C=~ a + d +g +j '
When I use absolute values of the substractions, everything goes fine.
But when I use signed differences, I get the following message :
"The smallest eigenvalue of the EM estimated variance-covariance matrix (Sigma) is smaller than 1e-05;"
Does anyone have an idea of what might be wrong ?
Thanks a lot,
Solène

Jeremy Miles
Sep 5, 2022, 10:25:50 PM9/5/22
to lav...@googlegroups.com
Is that an error message, or a warning?
Are the variables b, c, d, f, h, i, k, l used in the model?
The program is telling you that it found a solution, but the solution found a covariance matrix that shoudn't be able to exist. That means that the model is probably wrong.
Jeremy
--
You received this message because you are subscribed to the Google Groups "lavaan" group.
To unsubscribe from this group and stop receiving emails from it, send an email to lavaan+un...@googlegroups.com.
To view this discussion on the web visit https://groups.google.com/d/msgid/lavaan/18ac4ec1-0701-40e2-8dbf-7ef3172893a2n%40googlegroups.com.

Shu Fai Cheung
Sep 6, 2022, 3:25:35 AM9/6/22
to lavaan
Do your data have missing data? Did you use missing = "fiml"?
As Jeremy suggested, the problem may be due to linear dependence. And the warning message seems to be from a function that computes the sample covariance matrix using EM when missing data is present (I am not 100% certain about this).
This example produces the warning message you got:
library(lavaan)
#> This is lavaan 0.6-12
#> lavaan is FREE software! Please report any bugs.
HS.model <- ' visual =~ x1 + x2 + x3
textual =~ x4 + x5 + x6
speed =~ x7 + x8 + x9 '
dat <- HolzingerSwineford1939[, paste0("x", 1:9)]
set.seed(896532)
# Make x6, x1, and x2 nearly perfectly correlated
dat$x6 <- dat$x1 + dat$x2 + rnorm(nrow(dat), 0, .0001)
dat2 <- dat
# Create on missing cell
dat2[1, "x4"] <- NA
# Get the warning message
fit <- cfa(HS.model, data = dat, missing = "fiml")
#> Warning in lav_mvnorm_missing_h1_estimate_moments(Y = X[[g]], wt = WT[[g]], : lavaan WARNING:
#> The smallest eigenvalue of the EM estimated variance-covariance
#> matrix (Sigma) is smaller than 1e-05; this may cause numerical
#> instabilities; interpret the results with caution.
You can check the estimated correlations (taking into account missing data) by lavCor():
lavCor(fit)
As you used difference scores, the problem may not revealed by bivariate correlation nearly equal to 1, as in the example I created above. You can try the following:
# Variables that are nearly perfectly correlated
round(1 - 1 / diag((solve(cov2cor(lavInspect(fit, "sampstats")$cov)))), 3)
#> x1 x2 x3 x4 x5 x6 x7 x8 x9
#> 1.000 1.000 0.275 0.583 0.555 1.000 0.310 0.345 0.348
Hope this helps.
-- Shu Fai
As Jeremy suggested, the problem may be due to linear dependence. And the warning message seems to be from a function that computes the sample covariance matrix using EM when missing data is present (I am not 100% certain about this).
This example produces the warning message you got:
library(lavaan)
#> This is lavaan 0.6-12
#> lavaan is FREE software! Please report any bugs.
HS.model <- ' visual =~ x1 + x2 + x3
textual =~ x4 + x5 + x6
speed =~ x7 + x8 + x9 '
dat <- HolzingerSwineford1939[, paste0("x", 1:9)]
set.seed(896532)
# Make x6, x1, and x2 nearly perfectly correlated
dat$x6 <- dat$x1 + dat$x2 + rnorm(nrow(dat), 0, .0001)
dat2 <- dat
# Create on missing cell
dat2[1, "x4"] <- NA
# Get the warning message
fit <- cfa(HS.model, data = dat, missing = "fiml")
#> Warning in lav_mvnorm_missing_h1_estimate_moments(Y = X[[g]], wt = WT[[g]], : lavaan WARNING:
#> The smallest eigenvalue of the EM estimated variance-covariance
#> matrix (Sigma) is smaller than 1e-05; this may cause numerical
#> instabilities; interpret the results with caution.
You can check the estimated correlations (taking into account missing data) by lavCor():
lavCor(fit)
As you used difference scores, the problem may not revealed by bivariate correlation nearly equal to 1, as in the example I created above. You can try the following:
# Variables that are nearly perfectly correlated
round(1 - 1 / diag((solve(cov2cor(lavInspect(fit, "sampstats")$cov)))), 3)
#> x1 x2 x3 x4 x5 x6 x7 x8 x9
#> 1.000 1.000 0.275 0.583 0.555 1.000 0.310 0.345 0.348
This shows that x1, x2, and x6 are linearly dependent.
I believe there should be better solution (maybe an existing R function) to achieve what I did above but I have not yet found it.
-- Shu Fai

Nickname
Sep 6, 2022, 9:22:01 AM9/6/22
to lavaan
This is the approach that I would take in your situation:
1. Extract the observed and implied covariance matrices using lavInspect (if you do not have the observed covariance matrix already).
2. Use eigen() and det() to evaluate how close each is to being non-positive definite.
3. Use the itemanal() function from the rela package to obtain the squared multiple correlation predicting each observed variable from the others. (Hint: If your data is a data.frame, use as.matrix(myDataframe) with itemanal().) This is comparable to what Shu-Fai suggested (which was clever) using an existing package.
4. Extract the correlation residuals using the residuals(type='cor'). Look to see which variables and pairs of variables are involved in elements that are not well reproduced by the model.
If that does not help, picking up on Jeremy's question, you could explore further by fitting a model using the original variables instead of the differences. Define a composite variable with fixed weights of 1 and -1 for the appropriate observed variables (and no disturbance variance). Then define the common factor C in terms of these composite variables that represent the differences. Then repeat the above diagnostics with the larger data matrices of the original observed variables to see if they offer additional insight.
Keith
------------------------
Keith A. Markus
John Jay College of Criminal Justice, CUNY
http://jjcweb.jjay.cuny.edu/kmarkus
Frontiers of Test Validity Theory: Measurement, Causation and Meaning.
http://www.routledge.com/books/details/9781841692203/
Keith A. Markus
John Jay College of Criminal Justice, CUNY
http://jjcweb.jjay.cuny.edu/kmarkus
Frontiers of Test Validity Theory: Measurement, Causation and Meaning.
http://www.routledge.com/books/details/9781841692203/
Solène Frileux
Sep 7, 2022, 6:10:03 AM9/7/22
to lav...@googlegroups.com
Dear Jeremy,
Avis : lavaan WARNING: fit measures not available if model did not converge"
Thank you for your answer.
It is a warning message, but then the fit does not work, lavaan gives a table with no coefficients.
The complete message is the following :
"Avis : lavaan WARNING: The smallest eigenvalue of the EM estimated variance-covariance matrix (Sigma) is smaller than 1e-05;this may cause numerical instabilities; interpret the results with caution.Avis : lavaan WARNING: the optimizer warns that a solution has NOT been found!Avis : lavaan WARNING: estimation of the baseline model failed.
> summary(fit, fit.measures=TRUE, standardized = TRUE)Avis : lavaan WARNING: fit measures not available if model did not converge"
The variables b, c, d, f, h, i, k, l are just declared in the model . They are not used in regressions then.
The thing I do not understand is why the model is wrong when I use signed differences, but the model works with absolute differences.
The variables
b, c, d, f, h, i, k, l are zscores so some are under zero.
Thanks a lot,
Solène
You received this message because you are subscribed to a topic in the Google Groups "lavaan" group.
To unsubscribe from this topic, visit https://groups.google.com/d/topic/lavaan/K3Y_0fGs6MY/unsubscribe.
To unsubscribe from this group and all its topics, send an email to lavaan+un...@googlegroups.com.
To view this discussion on the web visit https://groups.google.com/d/msgid/lavaan/CAMtGSxns7XF4D6JAoN-r%3D%3DWcjoCAV8mEvztotsbnGmoBphH0gg%40mail.gmail.com.

Yves Rosseel
Sep 7, 2022, 6:26:44 AM9/7/22
to lav...@googlegroups.com
Could you show us the full model syntax?
The warning message is due to the use of missing = "fiml". In that case,
we need to 'estimate' the sample covariance matrix in the presence of
missing values, before model fitting even begins.
It is this estimated sample covariance matrix that is near-singular in
your case. This usually means that some observed variable is (almost)
linearly dependent on other observed variables.
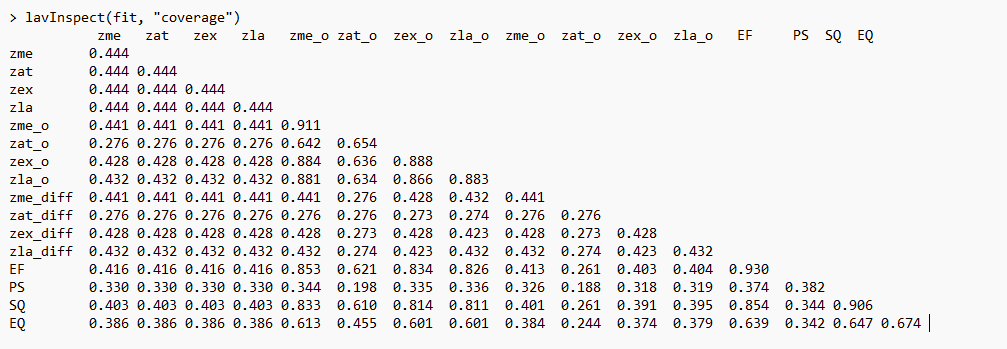
What is the output of lavInspect(fit, "coverage")? This shows the
proportion of complete cases per pair of variables. If those proportions
are very low (<40%), problems are very common.
Try to start with a smaller model, and add observed variables one by
one. That could help to isolate the problematic variable.
Yves.
The warning message is due to the use of missing = "fiml". In that case,
we need to 'estimate' the sample covariance matrix in the presence of
missing values, before model fitting even begins.
It is this estimated sample covariance matrix that is near-singular in
your case. This usually means that some observed variable is (almost)
linearly dependent on other observed variables.
What is the output of lavInspect(fit, "coverage")? This shows the
proportion of complete cases per pair of variables. If those proportions
are very low (<40%), problems are very common.
Try to start with a smaller model, and add observed variables one by
one. That could help to isolate the problematic variable.
Yves.
Solène Frileux
Sep 7, 2022, 9:16:09 AM9/7/22
to lav...@googlegroups.com
Thanks a lot.
Here is the whole model :
Model.1 <- ' ## measurement model
QI.s =~ zme + zat + zex + zla
QI.o =~ zme_o + zat_o + zex_o + zla_o
latent.QI =~ zme_diff + zat_diff + zex_diff + zla_diff
QI.s =~ zme + zat + zex + zla
QI.o =~ zme_o + zat_o + zex_o + zla_o
latent.QI =~ zme_diff + zat_diff + zex_diff + zla_diff
work =~ EF + PS
joy =~ SQ + EQ
## regressions
joy ~ work + latent.QI
work ~ latent.QI '
joy ~ work + latent.QI
work ~ latent.QI '
I indeed see many cases with proportions <40% when I do lavInspect(fit, "coverage")
I will try according to your instructions as well.
Thanks a lot,
Solène
--
You received this message because you are subscribed to a topic in the Google Groups "lavaan" group.
To unsubscribe from this topic, visit https://groups.google.com/d/topic/lavaan/K3Y_0fGs6MY/unsubscribe.
To unsubscribe from this group and all its topics, send an email to lavaan+un...@googlegroups.com.
To view this discussion on the web visit https://groups.google.com/d/msgid/lavaan/417847de-22bd-42e2-cba4-57aea6c54a12%40gmail.com.
Solène Frileux
Sep 7, 2022, 9:40:34 AM9/7/22
to lav...@googlegroups.com
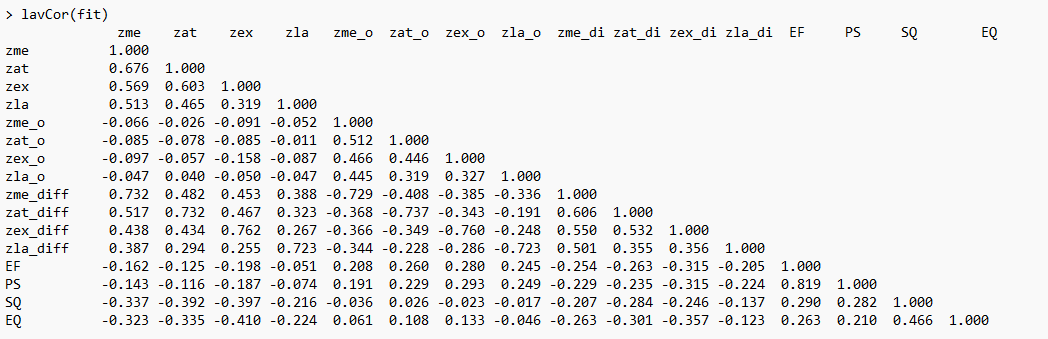
Indeed, I observe really small eigen values for signed differences, compared to absolute values :
$values
[1] 6.320509e+00 3.300666e+00 2.313665e+00 1.728585e+00 1.499220e+00 1.166973e+00 1.072735e+00 9.905443e-01 9.039375e-01
[10] 8.274487e-01 7.828544e-01 7.274916e-01 6.528584e-01 6.397334e-01 5.703489e-01 5.281037e-01 4.523329e-01 3.992977e-01
[19] 3.601284e-01 3.407084e-01 2.583178e-01 1.635385e-01 1.912528e-06 2.585583e-08 2.471914e-08 2.409142e-08
However, I have not yet understood how to find to which variables corresponds 2.409142e-08
I will go on looking thanks
Solène
--
You received this message because you are subscribed to a topic in the Google Groups "lavaan" group.
To unsubscribe from this topic, visit https://groups.google.com/d/topic/lavaan/K3Y_0fGs6MY/unsubscribe.
To unsubscribe from this group and all its topics, send an email to lavaan+un...@googlegroups.com.
To view this discussion on the web visit https://groups.google.com/d/msgid/lavaan/7345ef2d-15c8-402c-be8d-492f56176016n%40googlegroups.com.
Nickname
Sep 8, 2022, 9:12:33 AM9/8/22
to lavaan
That may depend on whether the results you posted were for the observed or implied moment matrix. For the observed matrix, I would be inclined to look for variables with the largest R^2 values and run those diagnostic regressions (predicted from all other observed variables in the model) in lavaan using FIML. If you meant the implied matrix, then you could fit the diagnostic regressions to the implied matrix using lavaan. Either way, this should be along side the other advice offered in this thread. zat_o and zat_difference stand out to me in the coverage matrix. You could also fit an unconstrained model with nothing but free covariances using FIML in lavaan with the difference variables to see how FIML handles that and what the FIML estimated covariance matrix looks like. Problems with the observed matrix might suggest a data issue such as with missing data whereas problems with the implied matrix in the absence of problems with the observed matrix might instead suggest a model issue.
Keith
------------------------
Keith A. Markus
John Jay College of Criminal Justice, CUNY
http://jjcweb.jjay.cuny.edu/kmarkus
Frontiers of Test Validity Theory: Measurement, Causation and Meaning.
http://www.routledge.com/books/details/9781841692203/
Keith A. Markus
John Jay College of Criminal Justice, CUNY
http://jjcweb.jjay.cuny.edu/kmarkus
Frontiers of Test Validity Theory: Measurement, Causation and Meaning.
http://www.routledge.com/books/details/9781841692203/
Solène Frileux
Sep 9, 2022, 10:33:13 AM9/9/22
to lav...@googlegroups.com
Thank you very much, I finally solved the problem thanks to all your advices.
In the model
Model.1 <- ' ## measurement model
QI.s =~ zme + zat + zex + zla
QI.o =~ zme_o + zat_o + zex_o + zla_o
latent.QI =~ zme_diff + zat_diff + zex_diff + zla_diff
QI.s =~ zme + zat + zex + zla
QI.o =~ zme_o + zat_o + zex_o + zla_o
latent.QI =~ zme_diff + zat_diff + zex_diff + zla_diff
work =~ EF + PS
joy =~ SQ + EQ
## regressions
joy ~ work + latent.QI
work ~ latent.QI '
joy ~ work + latent.QI
work ~ latent.QI '
I defined outside of the syntax variables QI.s and QI.o . They are part of the dataset.
I only kept the latent variable definition inside the syntax :
Model.1 <- ' ## measurement model
latent.QI =~ zme_diff + zat_diff + zex_diff + zla_diff
work =~ EF + PS
joy =~ SQ + EQ
## regressions
joy ~ work + latent.QI
work ~ latent.QI '
joy ~ work + latent.QI
work ~ latent.QI '
Now I do not have the warning message anymore, and it fits quite well.
I learned plenty of things thanks to your implication.
Have a great day,
Solène
To view this discussion on the web visit https://groups.google.com/d/msgid/lavaan/32c354e9-3d15-468b-a75c-2c40a4d18c6bn%40googlegroups.com.
Solène Frileux
Sep 12, 2022, 11:09:43 AM9/12/22
to lav...@googlegroups.com
Dear Keith,
Thanks for the composite variables idea.
I have tried the following syntax :
' ## Composite model
mem <~ -1* zmem_o + 1* zmem
att <~ -1* zatt_o + 1* zatt
exec <~ -1* zexec_o + 1* zexec
lang <~ -1* zlang_o + 1* zlang
## Second-order common factor
cog =~ mem + att + exec + lang
## Reflective measurement model
work =~ EGF_cor + PSP_
qual =~ SQOL + EQ5D_cor
## Structural Model
qual ~ work + cog
work~ cog '
But I get this warning :
lavaan WARNING: Could not compute standard errors! The information matrix could not be inverted. This may be a symptom that the model is not identified.
Avis : lavaan WARNING: could not invert information matrix needed for robust test statistic
With summary, I only get the standard results.
Do you have any idea that may explain this message ?
Thanks again,
Solène
To view this discussion on the web visit https://groups.google.com/d/msgid/lavaan/32c354e9-3d15-468b-a75c-2c40a4d18c6bn%40googlegroups.com.
Keith Markus
Sep 13, 2022, 8:38:41 AM9/13/22
to lavaan
Solene,
Have you taken stock of the parameters in the model using the output, the parameter table, or the lavInspect() parameter matrices? Are there any unintended parameters in the model. I am not sure how the <~ syntax interacts with =~ syntax when using the same variable from the left hand side of <~ on the right hand side of =~. I am wondering if the latter overrode the former and freed unexplained variances for the composites. You want those fixed to zero.
Keith
------------------------
Keith A. Markus
John Jay College of Criminal Justice, CUNY
http://jjcweb.jjay.cuny.edu/kmarkus
Frontiers of Test Validity Theory: Measurement, Causation and Meaning.
http://www.routledge.com/books/details/9781841692203/
Keith A. Markus
John Jay College of Criminal Justice, CUNY
http://jjcweb.jjay.cuny.edu/kmarkus
Frontiers of Test Validity Theory: Measurement, Causation and Meaning.
http://www.routledge.com/books/details/9781841692203/
Keith Markus
Sep 13, 2022, 10:26:58 AM9/13/22
to lavaan
Solene,
I tried fitting a simplified version of your model and realized that I was misunderstanding it. Imposing a restricted covariance structure on the difference variables does not restrict the covariance structure of the observed variables. They are treated as exogenous and their covariance matrix is not constrained by the model. For that to work, all the arrows would have to be pointing to the observed variables.
If you had more time points, I might suggest a growth curve model for each observed variable with a common factor model for the intercept and slope variables.
Your initial strategy of using the difference scores as observed variables seems statistically sound but conceptually I am not sure that there is good reason to expect the difference scores to have the same covariance structure as the observed scores. Imagine sets of scores that rank order the cases the same way but which are changing in different directions from pre to post, some difference scores would be positive, others negative. In fact, if they change by the same amount, the ranking of the cases is completely lost and the difference becomes constant. Add some stochastic error around that and you get variability with no structure.
You could try flipping the model by fitting common factor models to the observed variables and then modeling latent differences between the pre and post common factors. However, you might have to covary the uniqueness of the corresponding observed variables from pre to post. There is a literature on latent difference models that can guide you through the details of such models. However, I would start with just a CFA of the pre and post variables and build from there adding a little at a time.
Keith
------------------------
Keith A. Markus
John Jay College of Criminal Justice, CUNY
http://jjcweb.jjay.cuny.edu/kmarkus
Frontiers of Test Validity Theory: Measurement, Causation and Meaning.
http://www.routledge.com/books/details/9781841692203/
Keith A. Markus
John Jay College of Criminal Justice, CUNY
http://jjcweb.jjay.cuny.edu/kmarkus
Frontiers of Test Validity Theory: Measurement, Causation and Meaning.
http://www.routledge.com/books/details/9781841692203/
Solène Frileux
Sep 14, 2022, 11:04:58 AM9/14/22
to lav...@googlegroups.com
Ok, thanks a lot for your time and advice. I will try that.
Have a great day.
Best,
Solène
To view this discussion on the web visit https://groups.google.com/d/msgid/lavaan/db6459fb-458f-4120-87ee-ca31a4c632f5n%40googlegroups.com.
Solène Frileux
Sep 21, 2022, 11:18:37 AM9/21/22
to lav...@googlegroups.com
Dear Keith,
Which package do you generally use for composite variables ? cSEM or seminr ? Concerning lavaan, I only find ancient tutorials about composite variables, and they appear to be too old to apply to the actual way of defining composite variables in lavaan.
Thanks a lot for your help,
Solène
Le mar. 6 sept. 2022 à 15:22, 'Nickname' via lavaan <lav...@googlegroups.com> a écrit :
Keith Markus
Sep 23, 2022, 9:52:59 AM9/23/22
to lavaan
Solene,
I am not sure what happened but my reply to this ended up here: https://groups.google.com/g/lavaan/c/8jq_dOUQNqU.
Keith
------------------------
Keith A. Markus
John Jay College of Criminal Justice, CUNY
http://jjcweb.jjay.cuny.edu/kmarkus
Frontiers of Test Validity Theory: Measurement, Causation and Meaning.
http://www.routledge.com/books/details/9781841692203/
Keith A. Markus
John Jay College of Criminal Justice, CUNY
http://jjcweb.jjay.cuny.edu/kmarkus
Frontiers of Test Validity Theory: Measurement, Causation and Meaning.
http://www.routledge.com/books/details/9781841692203/
Reply all
Reply to author
Forward
0 new messages