Skip to first unread message

gaia...@gmail.com
Apr 2, 2019, 3:02:35 AM4/2/19
to lavaan
Dear users

Rönkkö, Mikko
Apr 2, 2019, 3:19:18 AM4/2/19
to lav...@googlegroups.com
Hi,
It is possible with the simulateData function, but why would you want to do so? Would it not be more straightforward and transparent to generate data using R’s built in random number functions?
For example, you can generate a common factor model with binary indicators using probit link like this:
N <- 10000
eta <- normal(N)
y1 <- (eta + normal(N))>0
y2 <- (eta + normal(N))>0
y2 <- (eta + normal(N))>0
If you want to generate correlated exogenous variables, you can do that with the mvrnorm function from the MASS package.
Mikko
--
You received this message because you are subscribed to the Google Groups "lavaan" group.
To unsubscribe from this group and stop receiving emails from it, send an email to lavaan+un...@googlegroups.com.
To post to this group, send email to lav...@googlegroups.com.
Visit this group at https://groups.google.com/group/lavaan.
For more options, visit https://groups.google.com/d/optout.
Mario Garrido
Apr 2, 2019, 3:51:22 AM4/2/19
to lav...@googlegroups.com
Dear Dr. Rönkkö,
thanks so much for your fast reply.
I want to 'force' the path coefficients connecting variables and generate a dataset following those conditions. Then, I want to assess whether I can obtain those set values (or how close from those values) using different estimation methods under different conditions. However, I am not sure if is possible to do it and whether it has logic to do it.
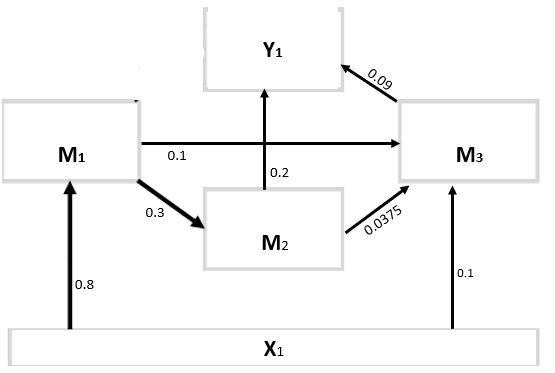
I have found a simple example (http://lavaan.ugent.be/tutorial/mediation.html). I think this is a good starting point but realize it is using the most simple mediation model and only with normal variables. I want something a little more complicated. something like the graph
Mario Garrido Escudero, PhD
Dr. Hadas Hawlena Lab
Mitrani Department of Desert Ecology
Jacob Blaustein Institutes for Desert Research
Ben-Gurion University of the Negev
Midreshet Ben-Gurion 84990 ISRAEL
phone: (+972) 08-659-6854
Rönkkö, Mikko
Apr 2, 2019, 3:57:13 AM4/2/19
to lav...@googlegroups.com
Hi,
In the example model you have just one exogenous variable. Why not just do
N <- 10000
x1 <- rnorm(N)
x1 <- rnorm(N)
m1 <- 0.8*x1 + rnorm(N)
m2 <- 0.3*m1 + rnorm(N)
m3 <- 0.1*x1 + 0.1*m1 + 0.0375*m2 + rnorm(N)
y1 <- 0.2*m2 + 0.09*m3 + rnorm(N)
data <- data.frame(x1, m1, m3, m3, y1)
If you want non-linearities and non-normal distributions, you need to specify what distributions and non-linear functions to use.
Mikko
Mario Garrido
Apr 2, 2019, 4:20:42 AM4/2/19
to lav...@googlegroups.com
Thanks. Im going to try
Mario Garrido
Apr 3, 2019, 5:50:21 AM4/3/19
to lav...@googlegroups.com
Dear Dr. Rönkkö,
thanks. It seems it works like this!.
I create the data according to the following code and then run a model and obtained the decided values.
However, how can I define as binary some variables? what I have to put here? GAp <- 0.8* sand + rnorm(what to put here?)
In any case, Im afraid that the concordancy between the values set in data generation and obtained later in the analyses only works for normal distributed variables due to the computation of path coefficients when variables are not normal, is that right?
The data I generated
N <- 10000
sand <- rnorm(N)
GAp <- 0.8*
sand + rnorm(N)
rodens <- 0.3*
GAp + rnorm(N)
fbrdn <- 0.1*
sand + 0.1*
GAp + 0.0375*
rodens + rnorm(N)
Myc <- 0.2*
rodens + 0.09*
fbrdn + rnorm(N)
data <- data.frame(
sand ,
GAp ,
rodens ,
fbrdn ,
Myc )
write.xlsx(data, "C:/Users/gaiarrido/Desktop/datageneratedlavaan.xlsx") # write sheet
The model I ran
DesiredBestModel<- '
Myc ~f*
rodens +g*fbrdn
fbrdn ~b*
sand +d*
GAp +e*rodens
rodens ~c*GAp
GAp ~a*sand
'
fit <- sem(DesiredBestModel, data = data)
summary(fit)
Mario Garrido
Apr 3, 2019, 6:00:05 AM4/3/19
to lav...@googlegroups.com
sorry, my question is what to put here for a binomial what to put here?(N)
Rönkkö, Mikko
Apr 3, 2019, 6:00:09 AM4/3/19
to lav...@googlegroups.com
Hi,
It depends how exactly you want to transform the normally distributed variable to a binary variable.
To do a probit model, you could do
GAp <-( 0.8* sand + rnorm(N))>0
To do a logit model, you could do
GAp <- inv.logit(0.8* sand) > runif(N)
(You can find the inv.logit function in e.g. the boot package.)
There are also other alternatives.
Mikko
Mario Garrido
Apr 3, 2019, 6:00:41 AM4/3/19
to lav...@googlegroups.com
thanks, I m going to try right now
Mario Garrido
Apr 4, 2019, 3:14:45 PM4/4/19
to lav...@googlegroups.com
Hi again,
what if I want to simulate a logit variable with two predictors?
it would be like that
y2dummy <- inv.logit(0.24*x+0.47*y1)>
runif(N)
or like this
#y2dummy <- inv.logit(0.24*x) + inv.logit(0.47*y1)> runif(N)Thanks
Rönkkö, Mikko
Apr 4, 2019, 3:16:32 PM4/4/19
to lav...@googlegroups.com
The first option.
Mikko
Sent from my iPhone
Mikko
<image.png>
Reply all
Reply to author
Forward
0 new messages