What values to report in cross-lag analysis
117 views
Skip to first unread message

SM
Apr 13, 2019, 12:23:33 AM4/13/19
to lavaan
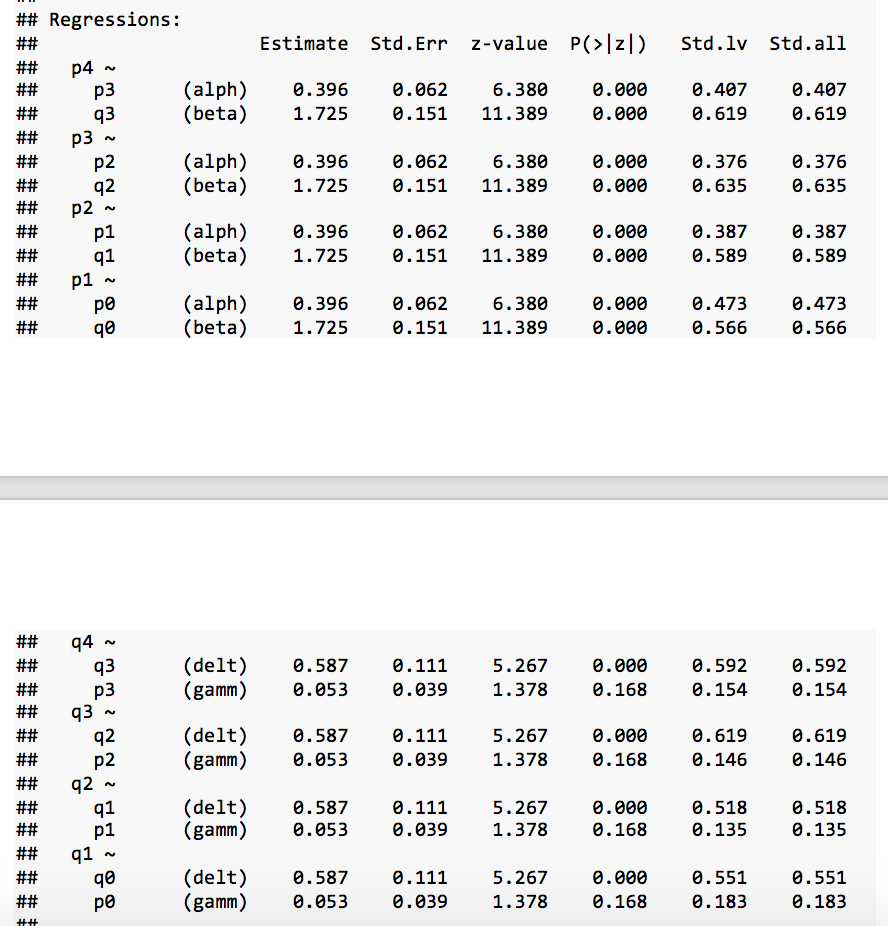
I am new to R, lavaan, and cross-lag analyses. Basically, I have two variables and I am evaluating the influence of each variable on the other across 5 time points. My regression output is below. I'm trying to figure out what I report, in-text and in the model figure. My interpretation of the results below is that q affects p across time, but p does not affect q across time. It was my understanding that I should report the standardized values (std.all), but then I am unsure what to use for the SE and p for those. What is confusing me is that the "estimates" are all the same across time points (e.g., all q to p paths = 1.73), but the standardized values vary. I am under the impression that the Std.Err and p values correspond to those estimates, not the standardized values (std.all). Sorry if I'm not making sense. Really mired in this. I really appreciate any help.

Terrence Jorgensen
Apr 16, 2019, 4:25:45 AM4/16/19
to lavaan
It was my understanding that I should report the standardized values (std.all), but then I am unsure what to use for the SE and p for those.
The common wisdom is to report standardized values as effect sizes to supplement the significance tests of unstandardized parameters. So you report SE and p values displayed for the estimates. If for some reason you need to test significance of the effect sizes, you can obtain them using the standardizedSolution() function.
What is confusing me is that the "estimates" are all the same across time points (e.g., all q to p paths = 1.73), but the standardized values vary.
Probably because the residual variances (and therefore total model-implied variances) still vary across time. There is nothing wrong with this (in fact, assuming homoskedasticity of residuals over time is probably unrealistic, although you could test the assumption by additionally constraining those parameters and using lavTestLRT() to compare models). Since you constrain paths to equality over time (assuming that assumption holds, which can be tested by comparing this model to one in which paths are unconstrained), you can just report the one unique set of estimates with their hypothesis tests, then supplement each test with multiple effect sizes that vary over time.
Terrence D. Jorgensen
Assistant Professor, Methods and Statistics
Research Institute for Child Development and Education, the University of Amsterdam
Sara Masland
Apr 16, 2019, 11:32:23 AM4/16/19
to lav...@googlegroups.com
This is so incredibly helpful. Thank you so much.
--
You received this message because you are subscribed to the Google Groups "lavaan" group.
To unsubscribe from this group and stop receiving emails from it, send an email to lavaan+un...@googlegroups.com.
To post to this group, send email to lav...@googlegroups.com.
Visit this group at https://groups.google.com/group/lavaan.
For more options, visit https://groups.google.com/d/optout.
Reply all
Reply to author
Forward
0 new messages