moderated mediation model included in a bigger path diagram

CSM
Dear all,
I want to specify a path diagram with 7 (observed) variables. It includes the following two relationships:
b ~ a; c ~ a+b.
Analyzing these three variables separately, it is possible to define a simple moderator mediation model: b is both a mediator and a moderator of the relationship between 'a' and c (or 'a' is a moderator in the relationship between b and c). All variables are continuous.
I would like to include this moderator effect in the overall (bigger) path diagram, with seven variables, ie., I would like to define the interaction variable ab=a*b and to include the following relationship in the path diagram:
c ~ ab
My doubts are:
1) Does this variable/path make sense in the overall path diagram?
2) In the affirmative case, I would like to know whether it is necessary to include the correlations
ab ~~ a; ab ~~ b
and require 'fixed.x=FALSE' in the 'sem' function (as it happens in the simple moderated mediation model, according to https://www.ncbi.nlm.nih.gov/pmc/articles/PMC4616155/pdf/nihms685520.pdf).
Can you please tell me your opinion?
Kind regards,
CSM

Terrence Jorgensen
1) Does this variable/path make sense in the overall path diagram?
2) In the affirmative case, I would like to know whether it is necessary to include the correlations
ab ~~ a; ab ~~ b
require 'fixed.x=FALSE'
CSM
Dear Professor Terrence Jorgensen,
Thank you so much for your explanation. When I wrote ‘path diagram’ I really meant ‘path model’; thank you very much for pointing this out.
By 'ab' I meant precisely the product variable that you described (added in the data set).
You are also correct about the inclusion of the diagram: I should have included it, to provide a better understanding of my problem.
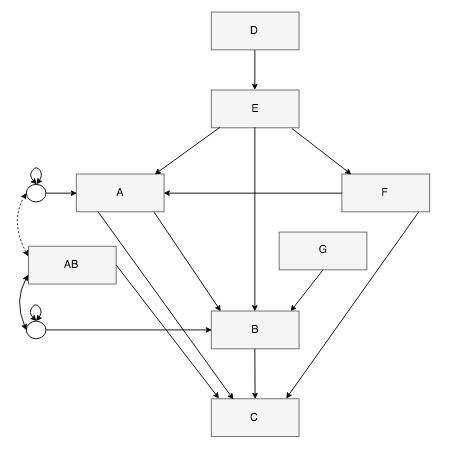
I’m attaching it now. For simplicity, I only drew the residuals for the endogenous variables A and B. The dashed line represents a non-significant value.
Looking at it, can you please tell me if the previous recommendations for the correlations AB ~~ A; AB ~~ B and the command ‘fixed.x=FALSE’ are still being valid? Do you see something strange/senseless in this diagram (except the fact that, for simplicity, correlations and residuals (endogenous variables) are not drawn)?
Kind regards,
CSM
Terrence Jorgensen
Looking at it, can you please tell me if the previous recommendations for the correlations AB ~~ A; AB ~~ B and the command ‘fixed.x=FALSE’ are still being valid?
Do you see something strange/senseless in this diagram (except the fact that, for simplicity, correlations and residuals (endogenous variables) are not drawn)?