how to convert lat/lon/elevation (wgs84) to cartesian coordinates?
6,868 views
Skip to first unread message

Joe Smith
Feb 11, 2022, 1:10:51 AM2/11/22
to LAStools - efficient tools for LiDAR processing
I exported a las file as csv file using las2txt.
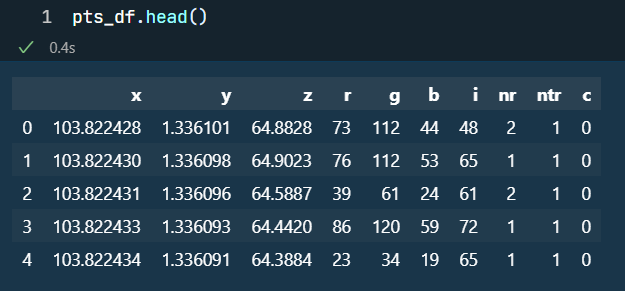
It seems that the xyz values are latitude/longitude/elevation recorded in wgs84 coordinate system. Latitude and longitude are using decimal degrees, and elevation is probably using meters as unit, as shown below.
May I ask if there is a tool in the LasTools package that can convert lat/lon/elevation to xyz cartesian corrdinates? If not, how to covner lat/lon in decimal degrees to cartesian coordinates mathematically?
I've tried to use the following python code to do the conversion. However, the xyz positions of the points seem to be "skewed" when visualized.
#########################################
# convert lat/long to cartesian
# ref: https://stackoverflow.com/a/55256861/3776170
def get_cartesian(lat=None, lon=None):
lat, lon = np.deg2rad(lat), np.deg2rad(lon)
R = 6378137 # radius of the earth in meters
x = R * np.cos(lat) * np.cos(lon)
y = R * np.cos(lat) * np.sin(lon)
return x, y
# ref: https://stackoverflow.com/a/55256861/3776170
def get_cartesian(lat=None, lon=None):
lat, lon = np.deg2rad(lat), np.deg2rad(lon)
R = 6378137 # radius of the earth in meters
x = R * np.cos(lat) * np.cos(lon)
y = R * np.cos(lat) * np.sin(lon)
return x, y
#########################################
Thanks.

Jorge Delgado García
Feb 12, 2022, 3:27:07 PM2/12/22
to last...@googlegroups.com
Dear Joe,
The truth is that coordinate systems always require a certain amount of attention. Particularly, I always recommend my students to use the corresponding EPSG codes for their definition, which LAStools also recognizes (and much other software, such as, for example, QGIS, etc.).
Specifically, your coordinates are in geographic coordinates and referenced according to a WGS84 reference ellipsoid, i.e. they would have an EPSG:4326 code. The transformation can be done with las2las but you need to know which system you want to transform it to (which can also be defined according to its own EPSG code). Although LAStools can work in any system, for example, you could opt for a Cartesian coordinate system defined in the WGS84 ellipsoid, which would be the 4978 code, my recommendation to avoid problems is that you use the official system projected in your country (for example, in my country -Spain- is ETRS89-UTM). You can consult the EPSG code in http://epsg.io or in the page https://spatialreference.org. Then in the las2las command, you must include the option -target_epsg <EPSG code>. You must take into account that the CRS EPSG:4978 has the origin of coordinates in the center of the Earth (ECEF).
As for the calculation you can do it with different programs, for example, the GDAL library allows to do it, or even check it with the applications that appear in some web pages like https://epsg.io or https://mygeodata.cloud/cs2cs/ (this last one allows the conversion of a list of points although with a limitation (I remember of 400 points). The calculation you indicate is not correct for your data since it considers a spherical Earth model, while your data is already considering the WGS84 ellipsoid.
I hope I have been able to help you with your problem.
--
Download LAStools at
https://rapidlasso.de
Manage your settings at
https://groups.google.com/g/lastools/membership
---
You received this message because you are subscribed to the Google Groups "LAStools - efficient tools for LiDAR processing" group.
To unsubscribe from this group and stop receiving emails from it, send an email to lastools+u...@googlegroups.com.
To view this discussion on the web visit https://groups.google.com/d/msgid/lastools/fa63e726-2fe9-40ef-963e-1af7cca469a2n%40googlegroups.com.
--


Arnleif Bjørstad
Feb 13, 2022, 12:22:57 PM2/13/22
to last...@googlegroups.com
You can use proj, download from proj.org. Believe it is open source. Library comes with utility exe - file that takes filename with coordinates as parameters. File should containe space delimited coordinates. You give epsg codes of source and dest coordinate system. If you use python, there is a wrapper lib called PyProj.
To view this discussion on the web visit https://groups.google.com/d/msgid/lastools/CADgtU_9sjV9ZPsv%2Bs0794zVoNaYEkhPOskf1f7k3QeuMdJ%3DdYQ%40mail.gmail.com.
Joe Smith
Feb 14, 2022, 2:31:33 AM2/14/22
to LAStools - efficient tools for LiDAR processing
Dear Professor Delgado,
Thank you very much for your detailed advice.
Following your suggestions, I solved the issue in the following steps:
1. convert the las file from WGS84 (EPSG 4326) format to EPSG 3414 (as the lidar scan was conducted in Singapore) using las2las:
las2las64 -i cloud.las -target_epsg 3414 -o output_3414.las
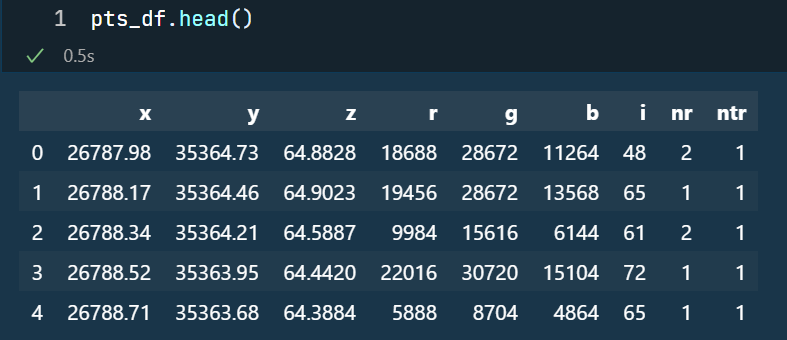
2. extract information from the las file as csv file for attributes xyz, RGB, intensity (i) num of returns (nr), and num of this return (ntr):
las2txt64 -i output_3414.las -o output_3414.csv -parse xyzRGBinrc -sep comma
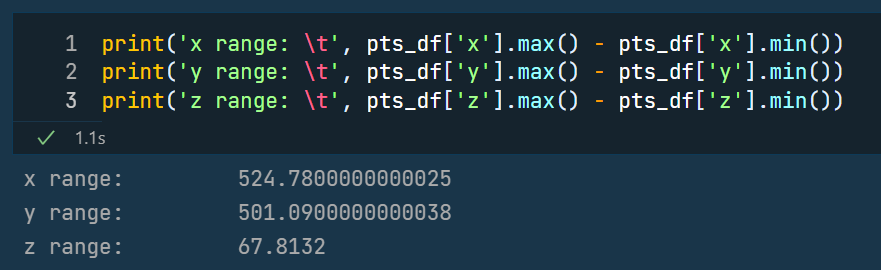
After reading the CSV file as a Pandas DataFrame, it seems the XYZ coordinates are in value ranges for a cartesian coordinate system:
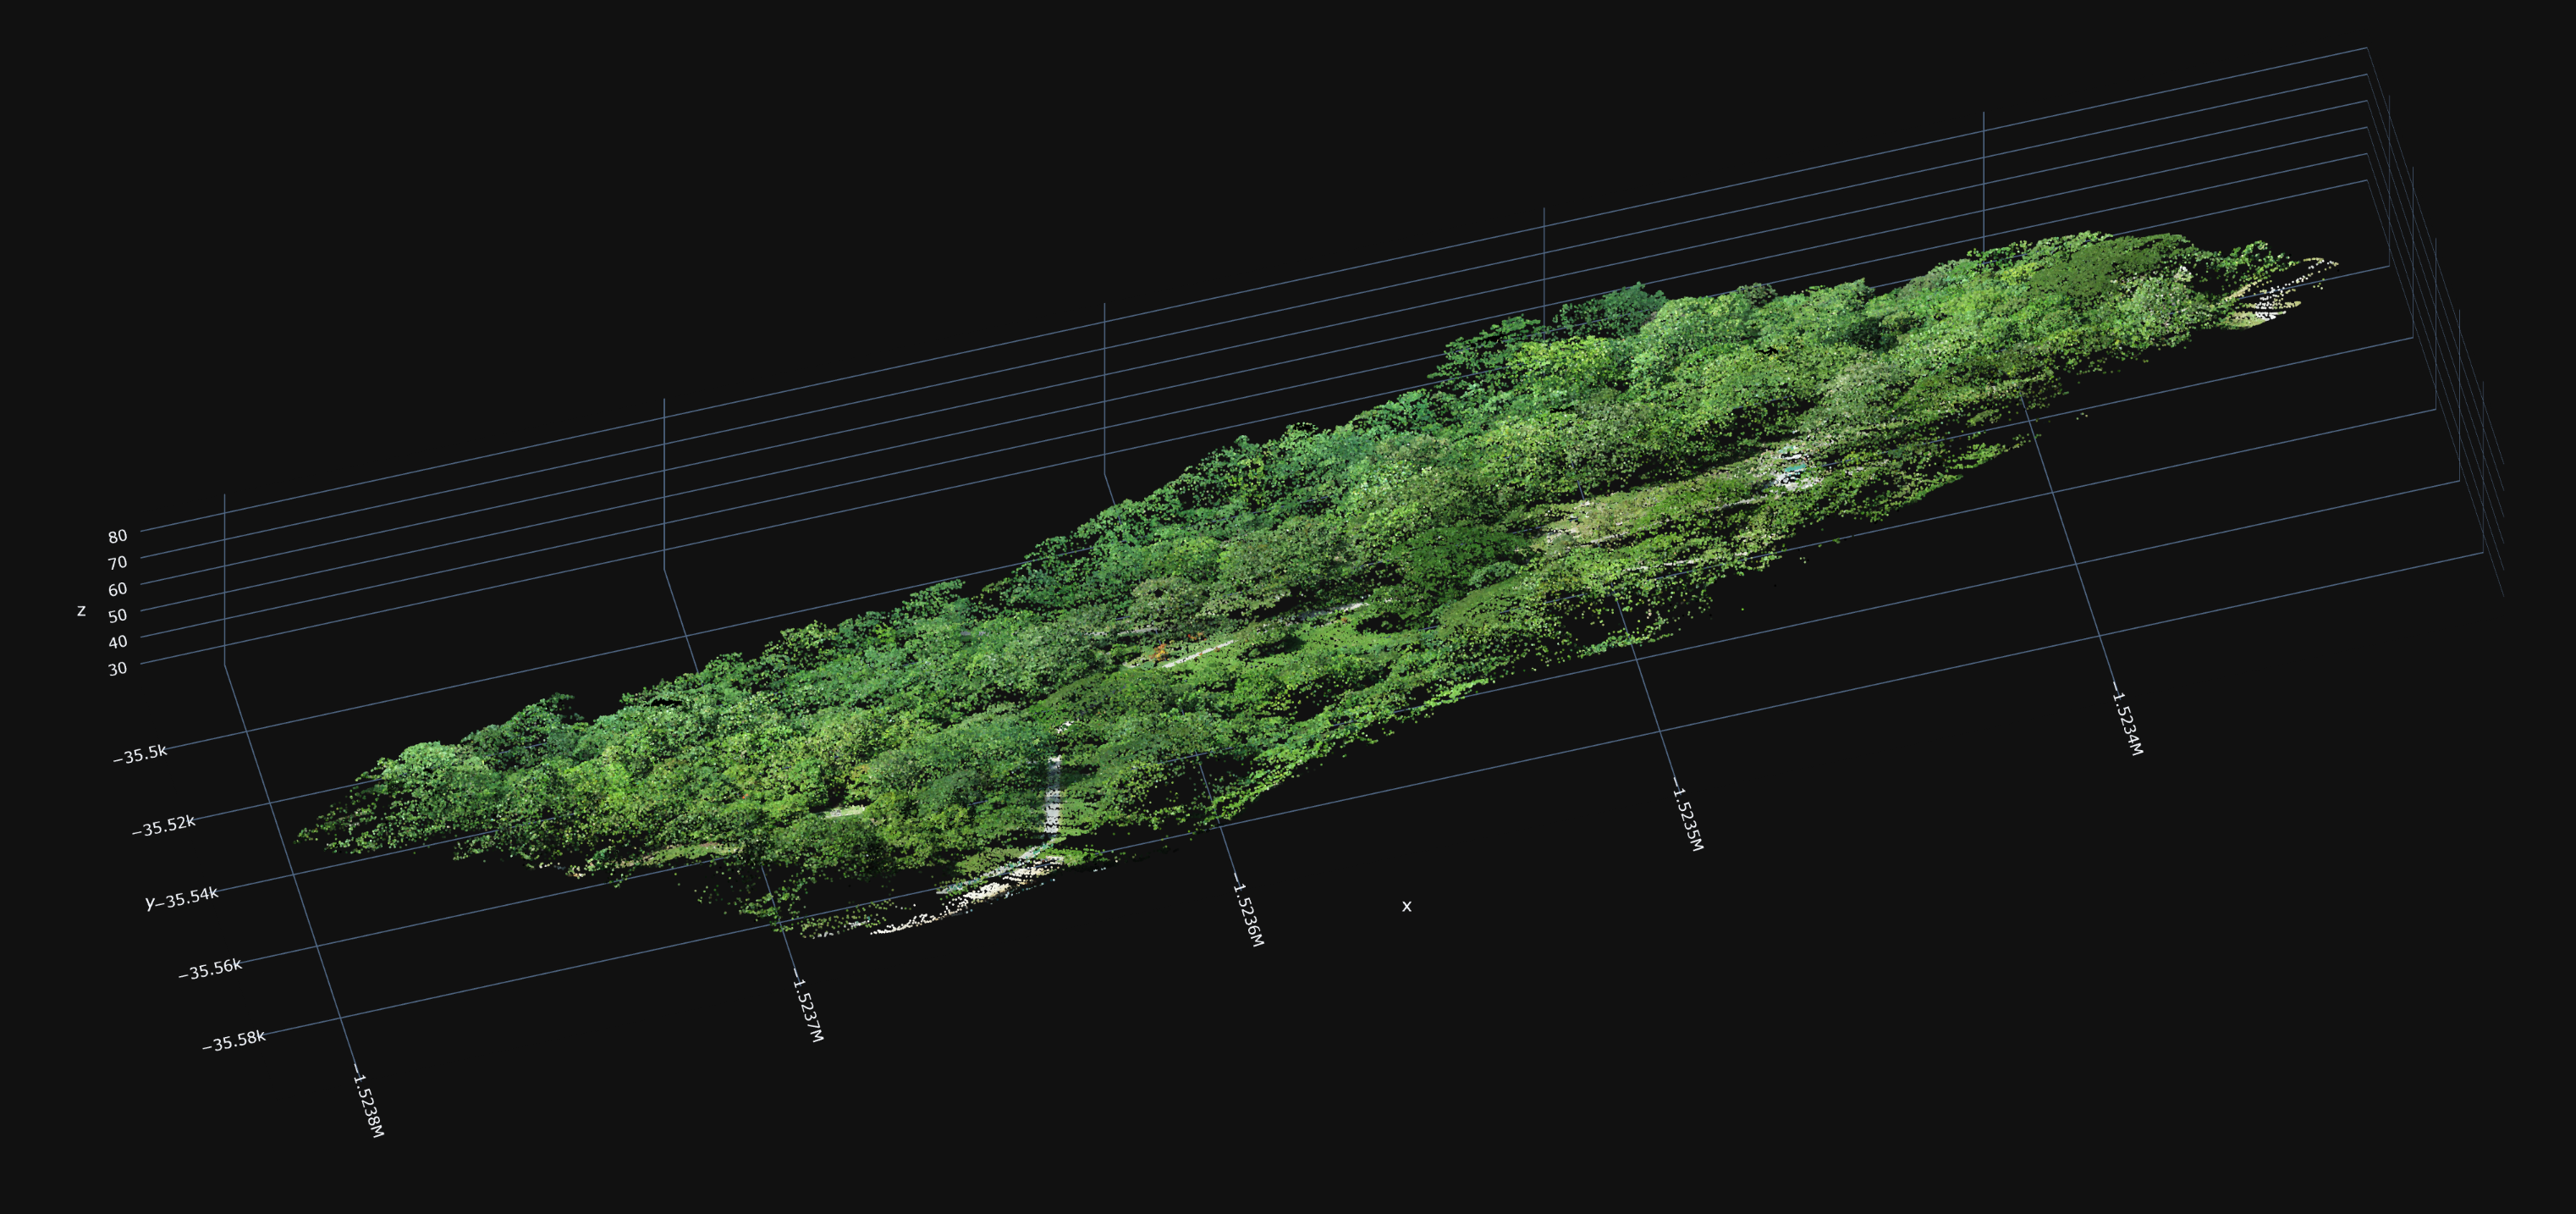
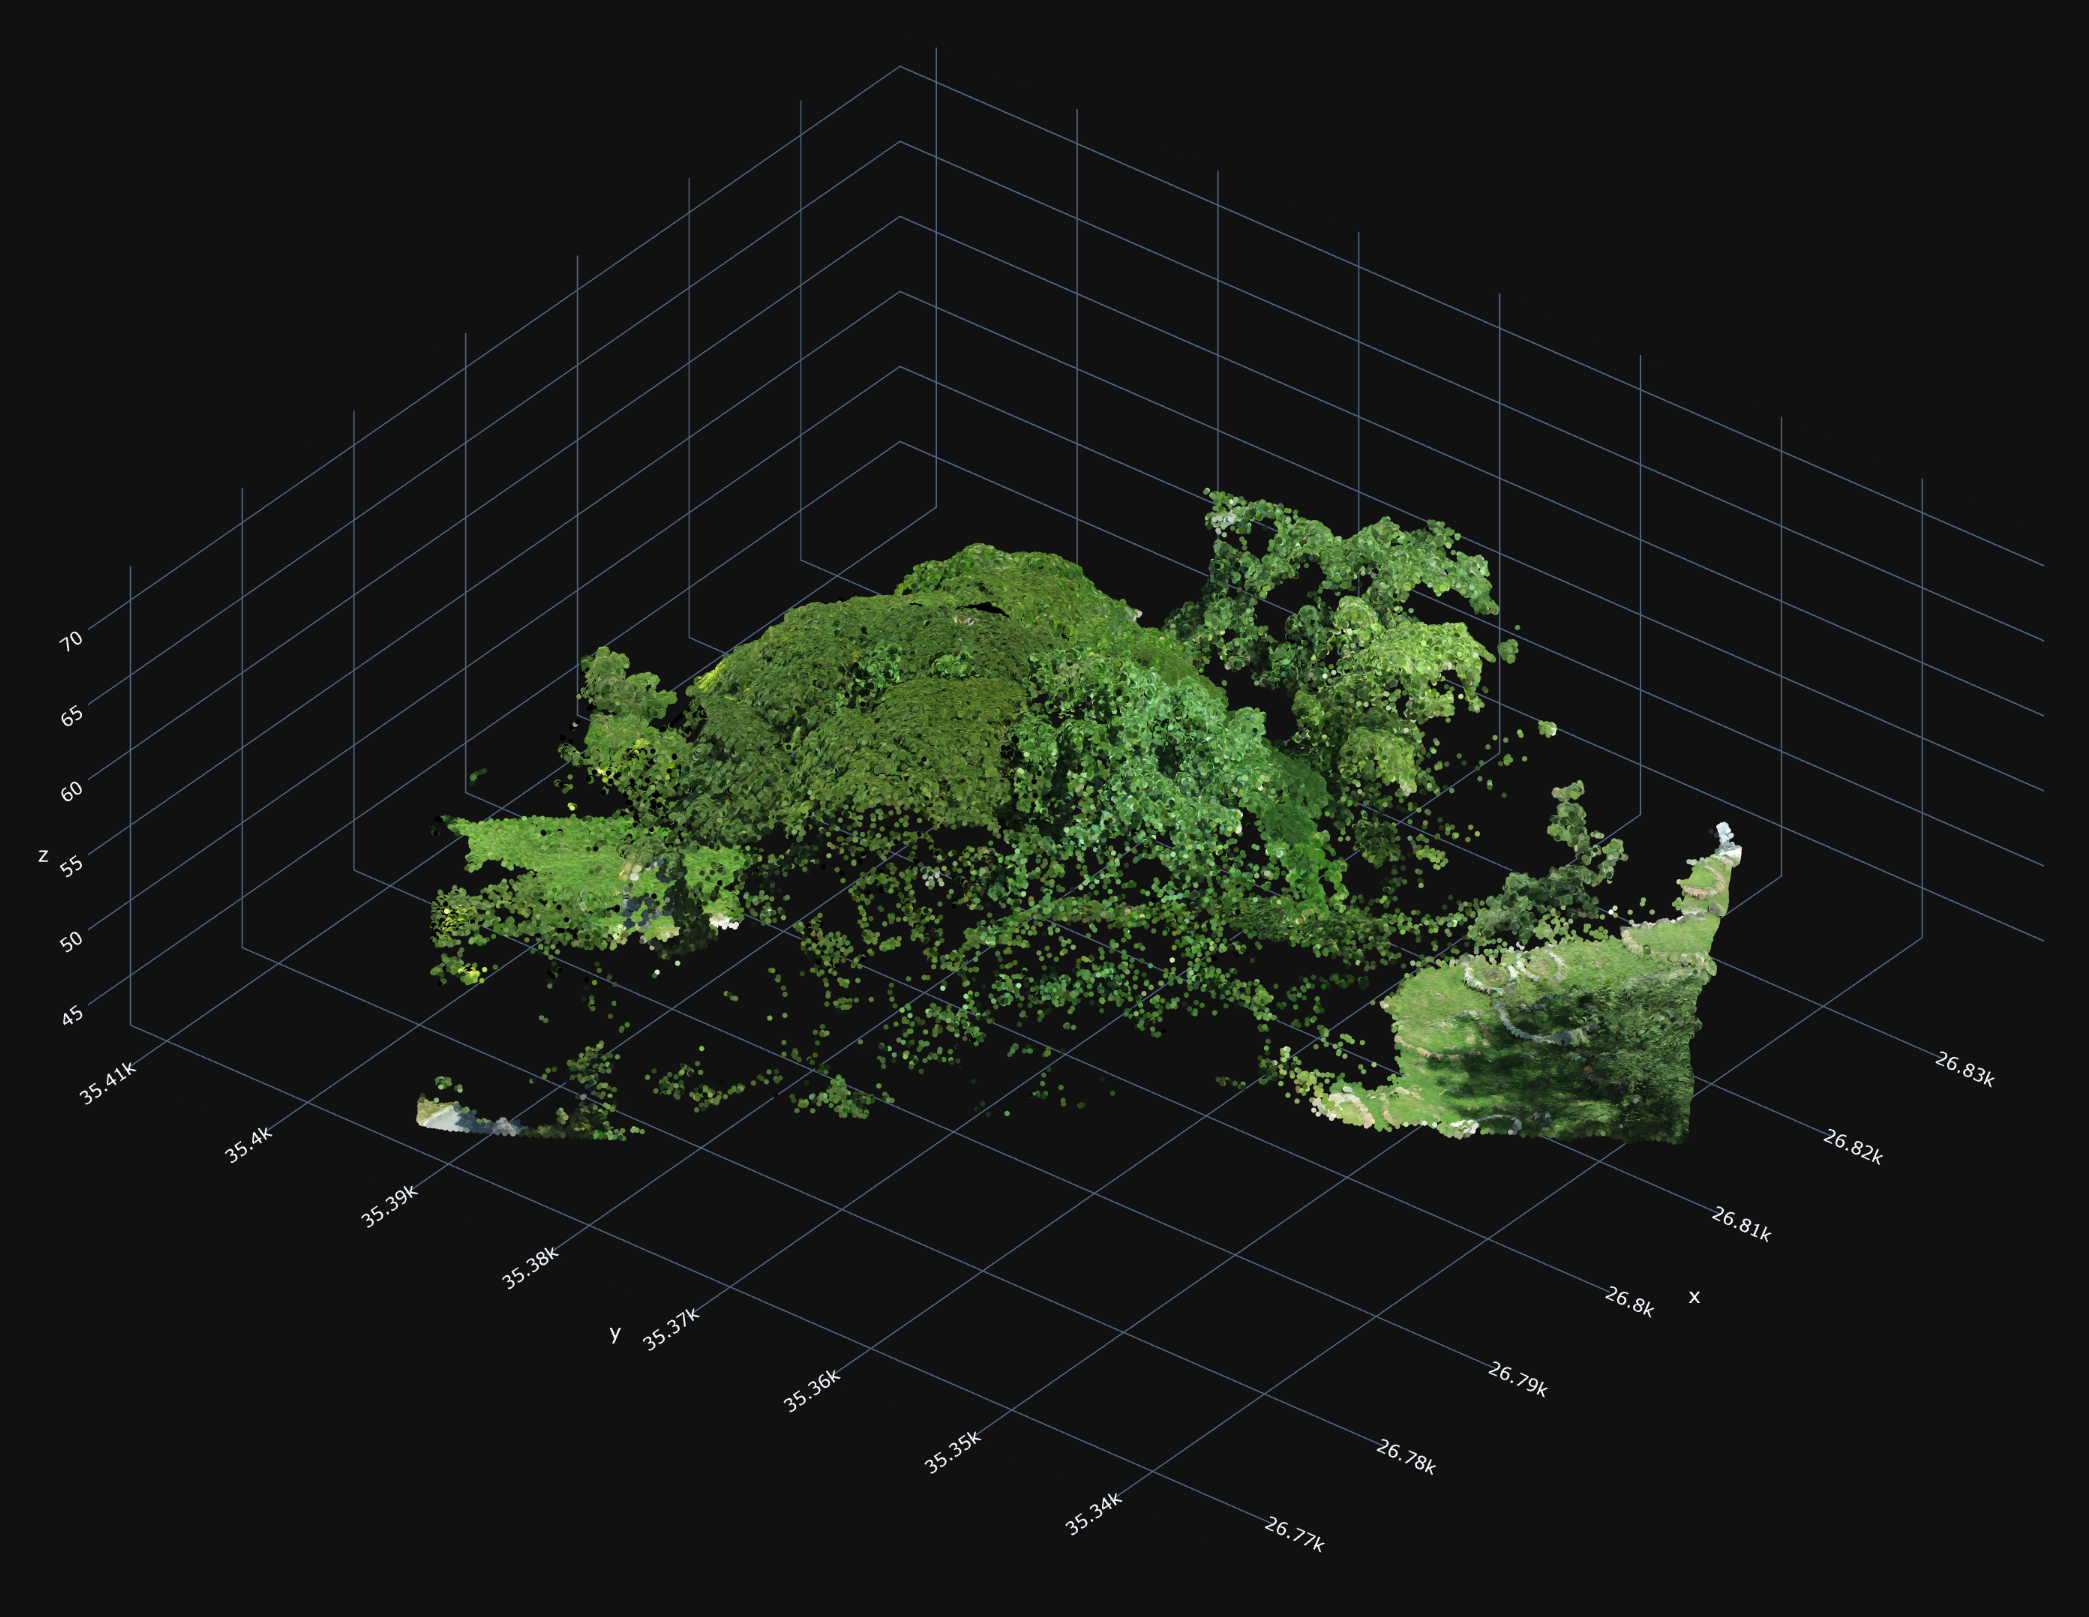
And, the points as visualized in 3D scatter plot using the XYZ coordinates seems to be correct, or reasonable at least, now:
The first 500k points:
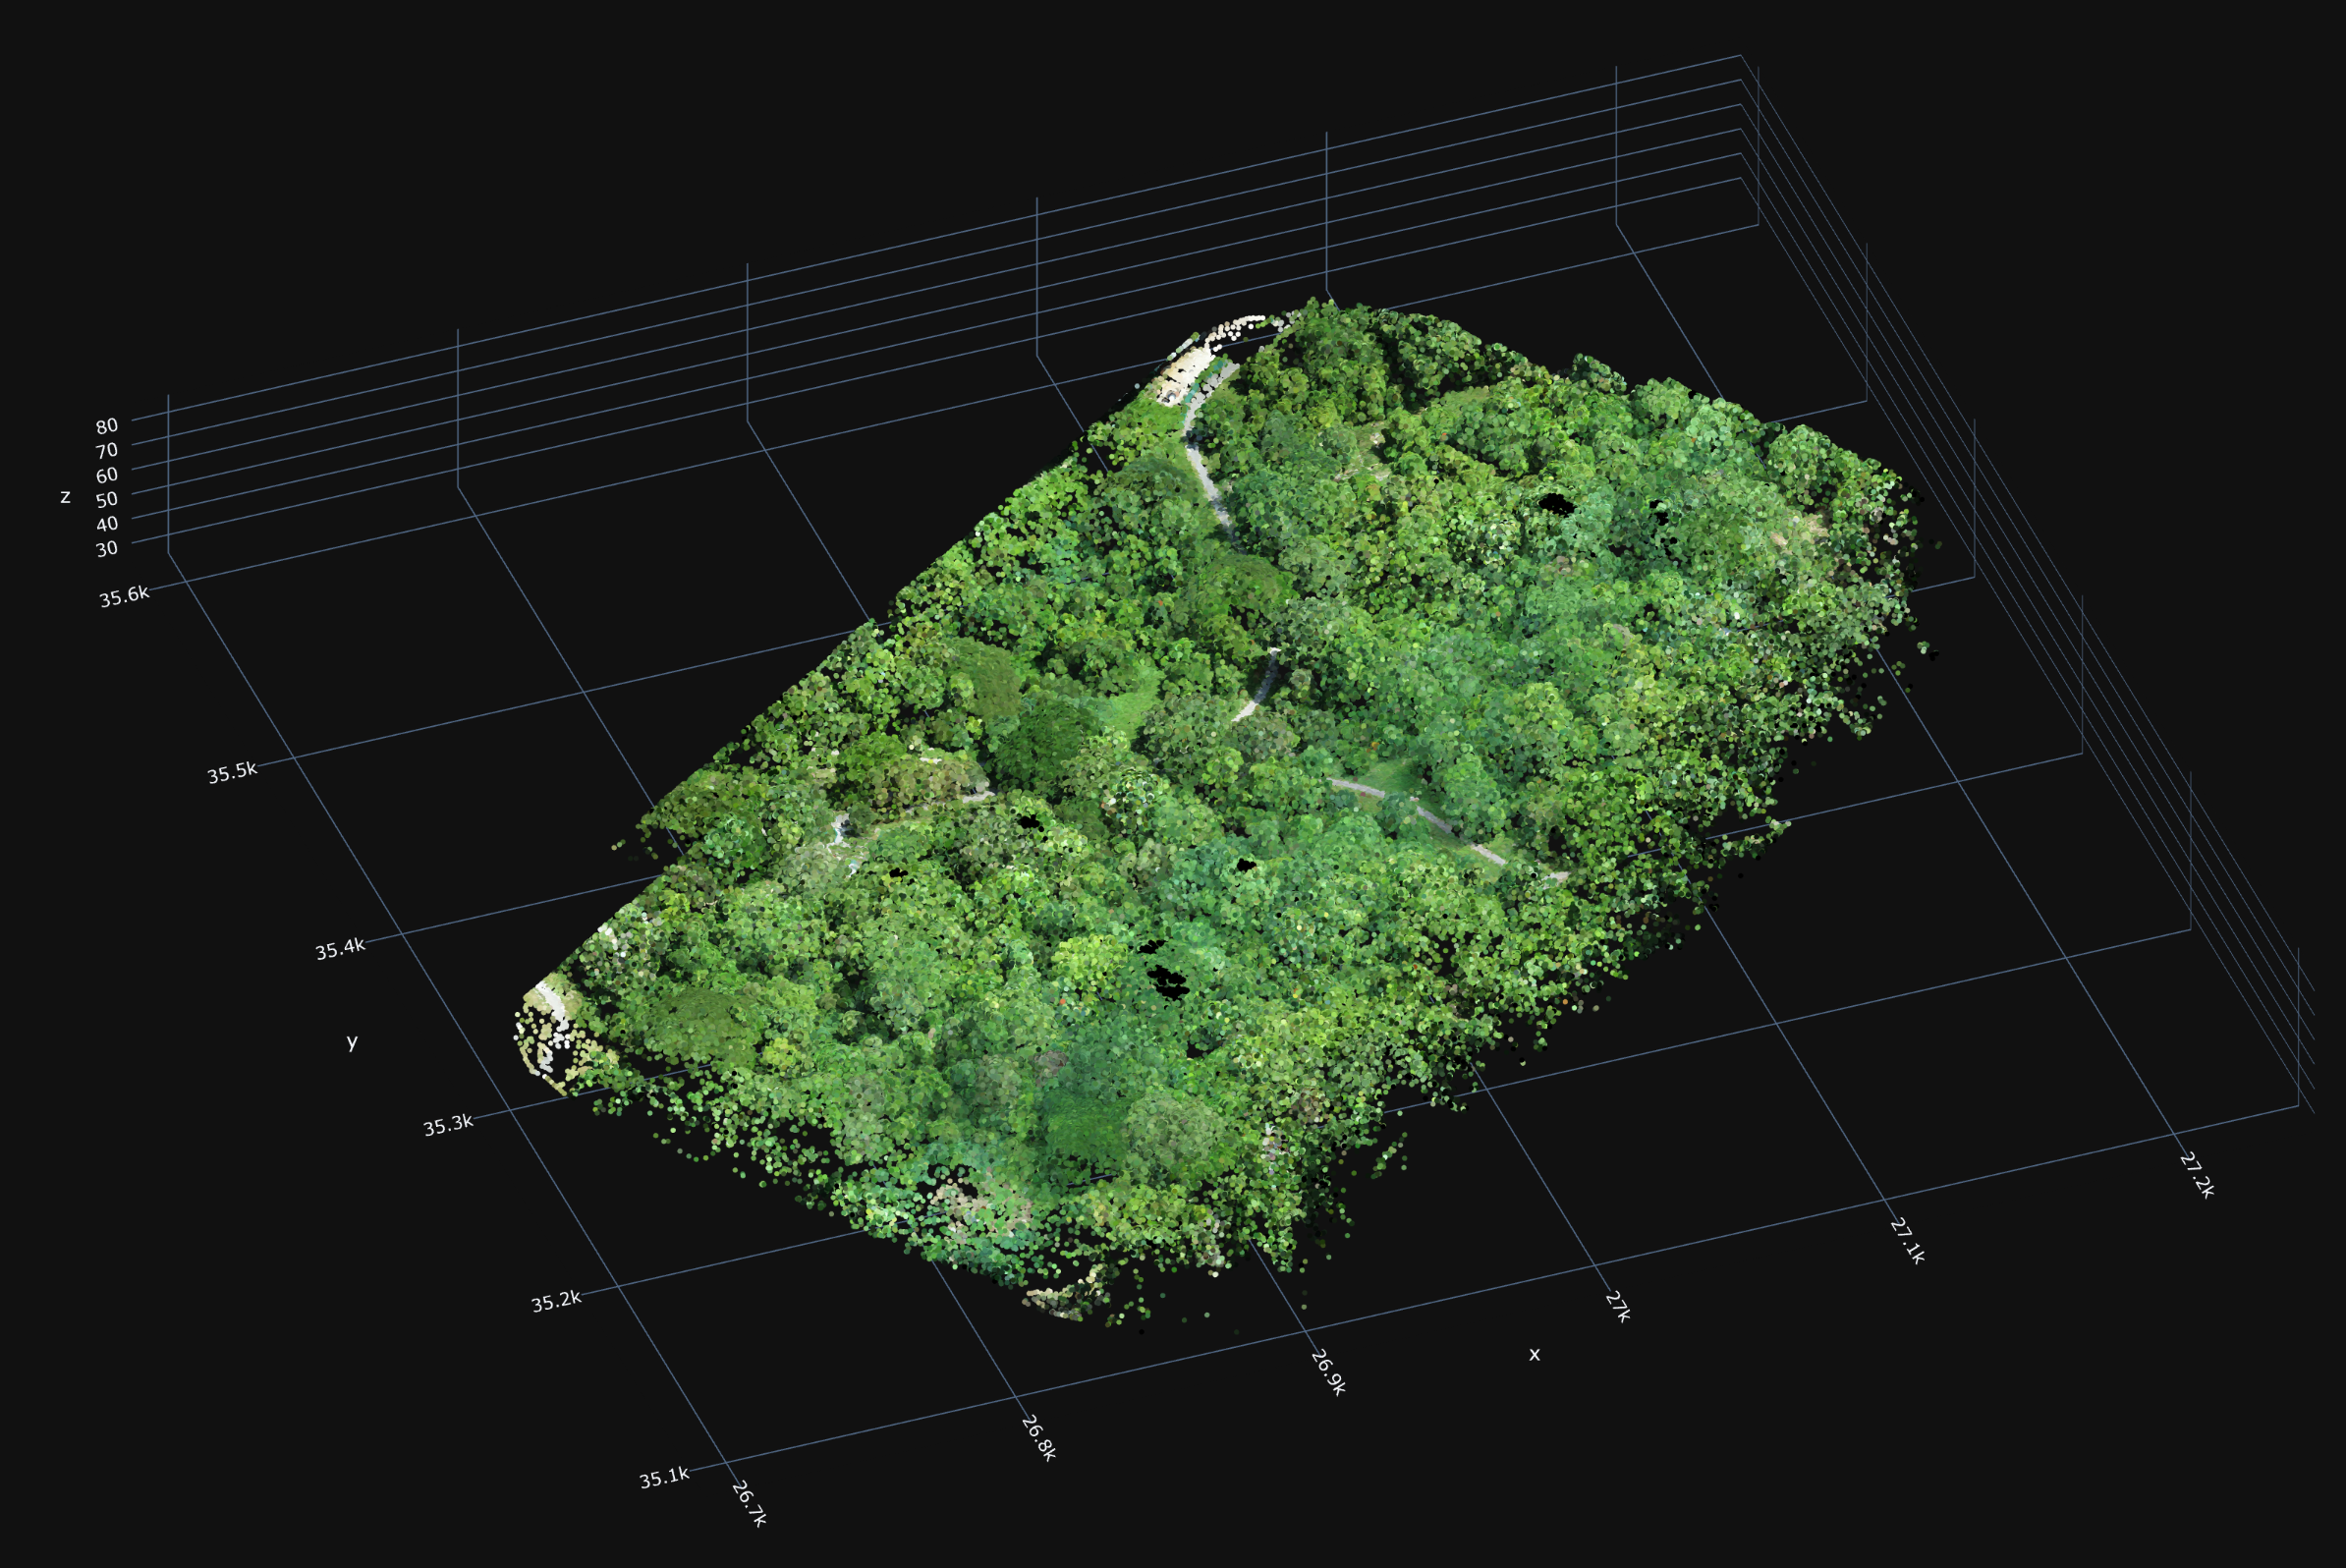
The full data set of 140M+ points, sub-sampled every 300 points:
Thank you very much, again, for your patience to illuminate a newbie like me.
I've learned a lot from your reply, and please allow me to take some more time to digest all the information.
Best regards
- Joe
Reply all
Reply to author
Forward
0 new messages