runviewer feature: non-linear time
48 показвания
Преминаване към първото непрочетено съобщение

Alexander Chuang
24.06.2022 г., 14:59:4424.06.22 г.
до the labscript suite
I am porting the control of an experiment to labscript, from a GUI based control software. In the process of learning to write and debugging new scripts, runviewer has been an extremely useful tool to catch my mistakes!
While browsing the runviewer github repo, I stumbled upon traces which have a non-linear time axis from an issue originating from Jan Werkmann's report: https://github.com/labscript-suite/runviewer/issues/14
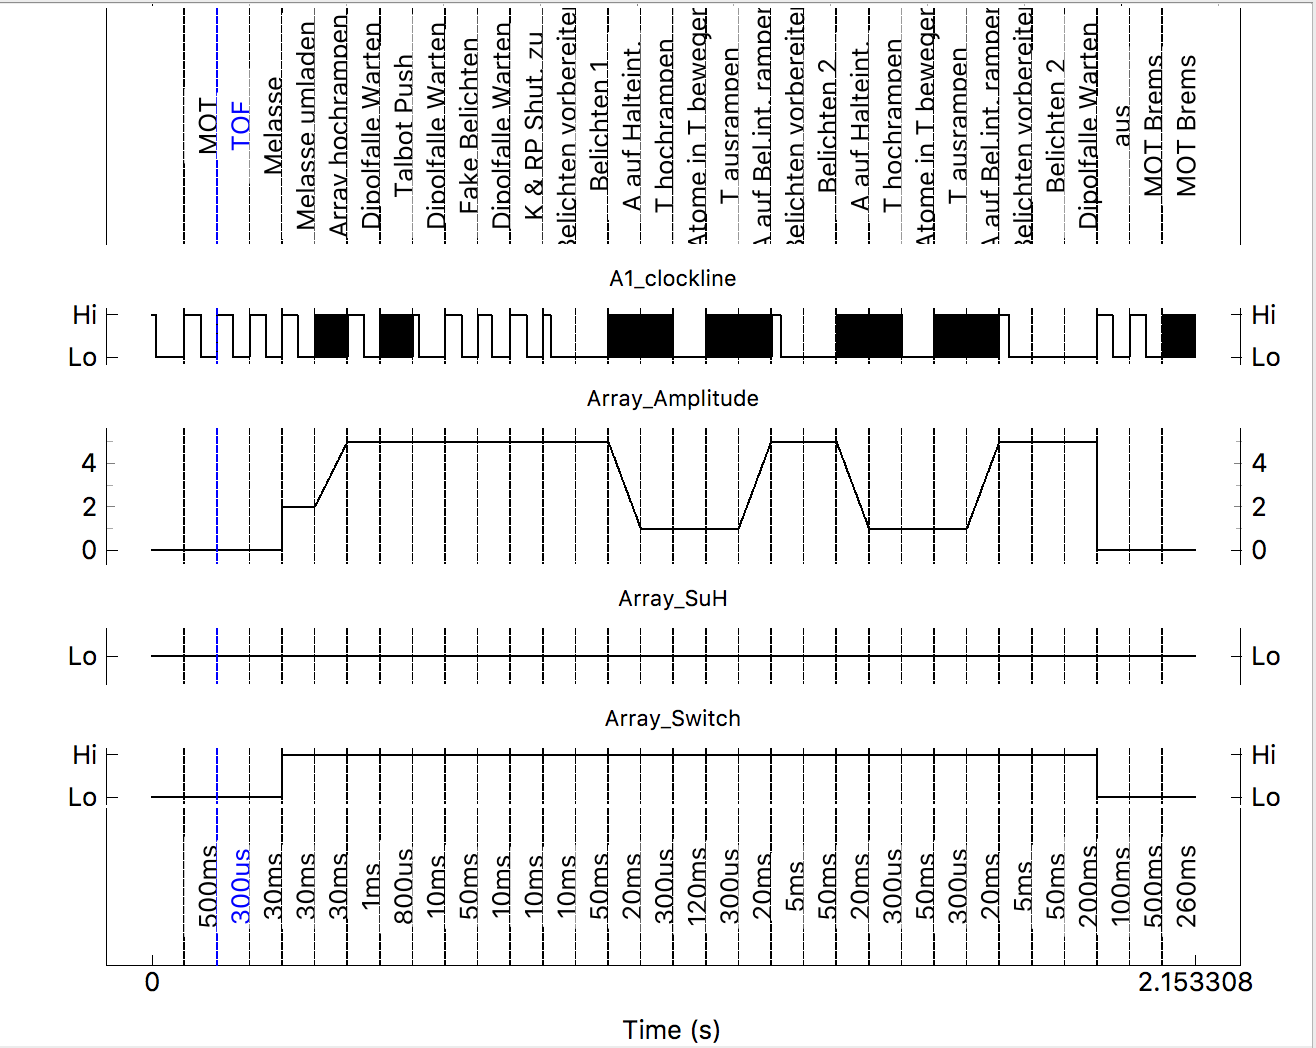
This non real-time plotting of the traces seems quite sensible in that each logical portion of the experiment sequence gets roughly the same visual representation. As I understand, the real-time visualization can be dominated by long, slow ramps (e.g. forced evaporations), while the "science" portion of the experiment remains hidden behind multiple zooms.
Is there an official feature which allows me to visualize experiments as in the attached photo, or do folks have suggestions on how I might better use runviewer? If not, I would be happy to contribute to runviewer, and if it's appropriate, I can move this conversation to the github issue tracker instead.

Chris Billington
25.06.2022 г., 3:44:1225.06.22 г.
до labscri...@googlegroups.com
Hi Alex,
Yes, this feature exists officially. To use it, you can add "time markers" in your experiment script with the add_time_marker() function:
This labels points in time that should be used by runviewer to make a nonlinear time axis. Runviewer will allocate an equal amount of space on its y axis to the time in between each pair of adjacent time markers. In runviewer, you'll want to click the "space markers evenly" button in the toolbar above the plots.
Regards,
Chris
--
You received this message because you are subscribed to the Google Groups "the labscript suite" group.
To unsubscribe from this group and stop receiving emails from it, send an email to labscriptsuit...@googlegroups.com.
To view this discussion on the web, visit https://groups.google.com/d/msgid/labscriptsuite/1a22401d-66af-4a84-92b4-01736b2ffb96n%40googlegroups.com.

dihm....@gmail.com
25.06.2022 г., 18:58:1125.06.22 г.
до the labscript suite
TIL runviewer markers can do nonlinear time.
Alex, if you are still interested in contributing, it appears that an update to the runviewer documentation is in order. Something very brief and simple about setting up markers correctly (with a cool looking screenshot and a cross-link to the docs page Chris posted) would certainly be appreciated.
-David
Alexander Chuang
27.06.2022 г., 11:40:5927.06.22 г.
до the labscript suite
Hi Chris,
Thanks for the pointer, this is exactly what I was looking for!
Best,
Alex
PS David, I'll be playing with this feature a bit and can definitely look into adding to the docs.
Отговор до всички
Отговор до автора
Препращане
0 нови съобщения