[tracing] Knative serving and eventing tracing issues
131 views
Skip to first unread message

Andrey Stelmashenko
Jun 3, 2022, 8:33:38 AM6/3/22
to Knative Users
Hi Community,
I'm trying to reproduce this blog post https://knative.dev/blog/articles/distributed-tracing/ but using default knative capabilities in a bit other way.
My setup is simple, I have two services, broker and trigger:
Heartbit ksvc - is a service
EventDisplay ksvc - is another service
(ce) is cloudevent.
--(ce)--> - means sending cloud event
Heartbit ksvc --(ce)--> Broker --(ce)--> Trigger --(ce)--> EventDisplay ksvc
Heartbit ksvc is reusing incoming request headers, tracing headers injected by activator-service.
I configured tracing according to
Serving tracing - https://knative.dev/docs/serving/accessing-traces/
Eventing tracing - https://knative.dev/docs/eventing/accessing-traces/
For now I set debug: true for both configurations.
What I get is two separate traces:
Heartbit ksvc --(ce)--> Broker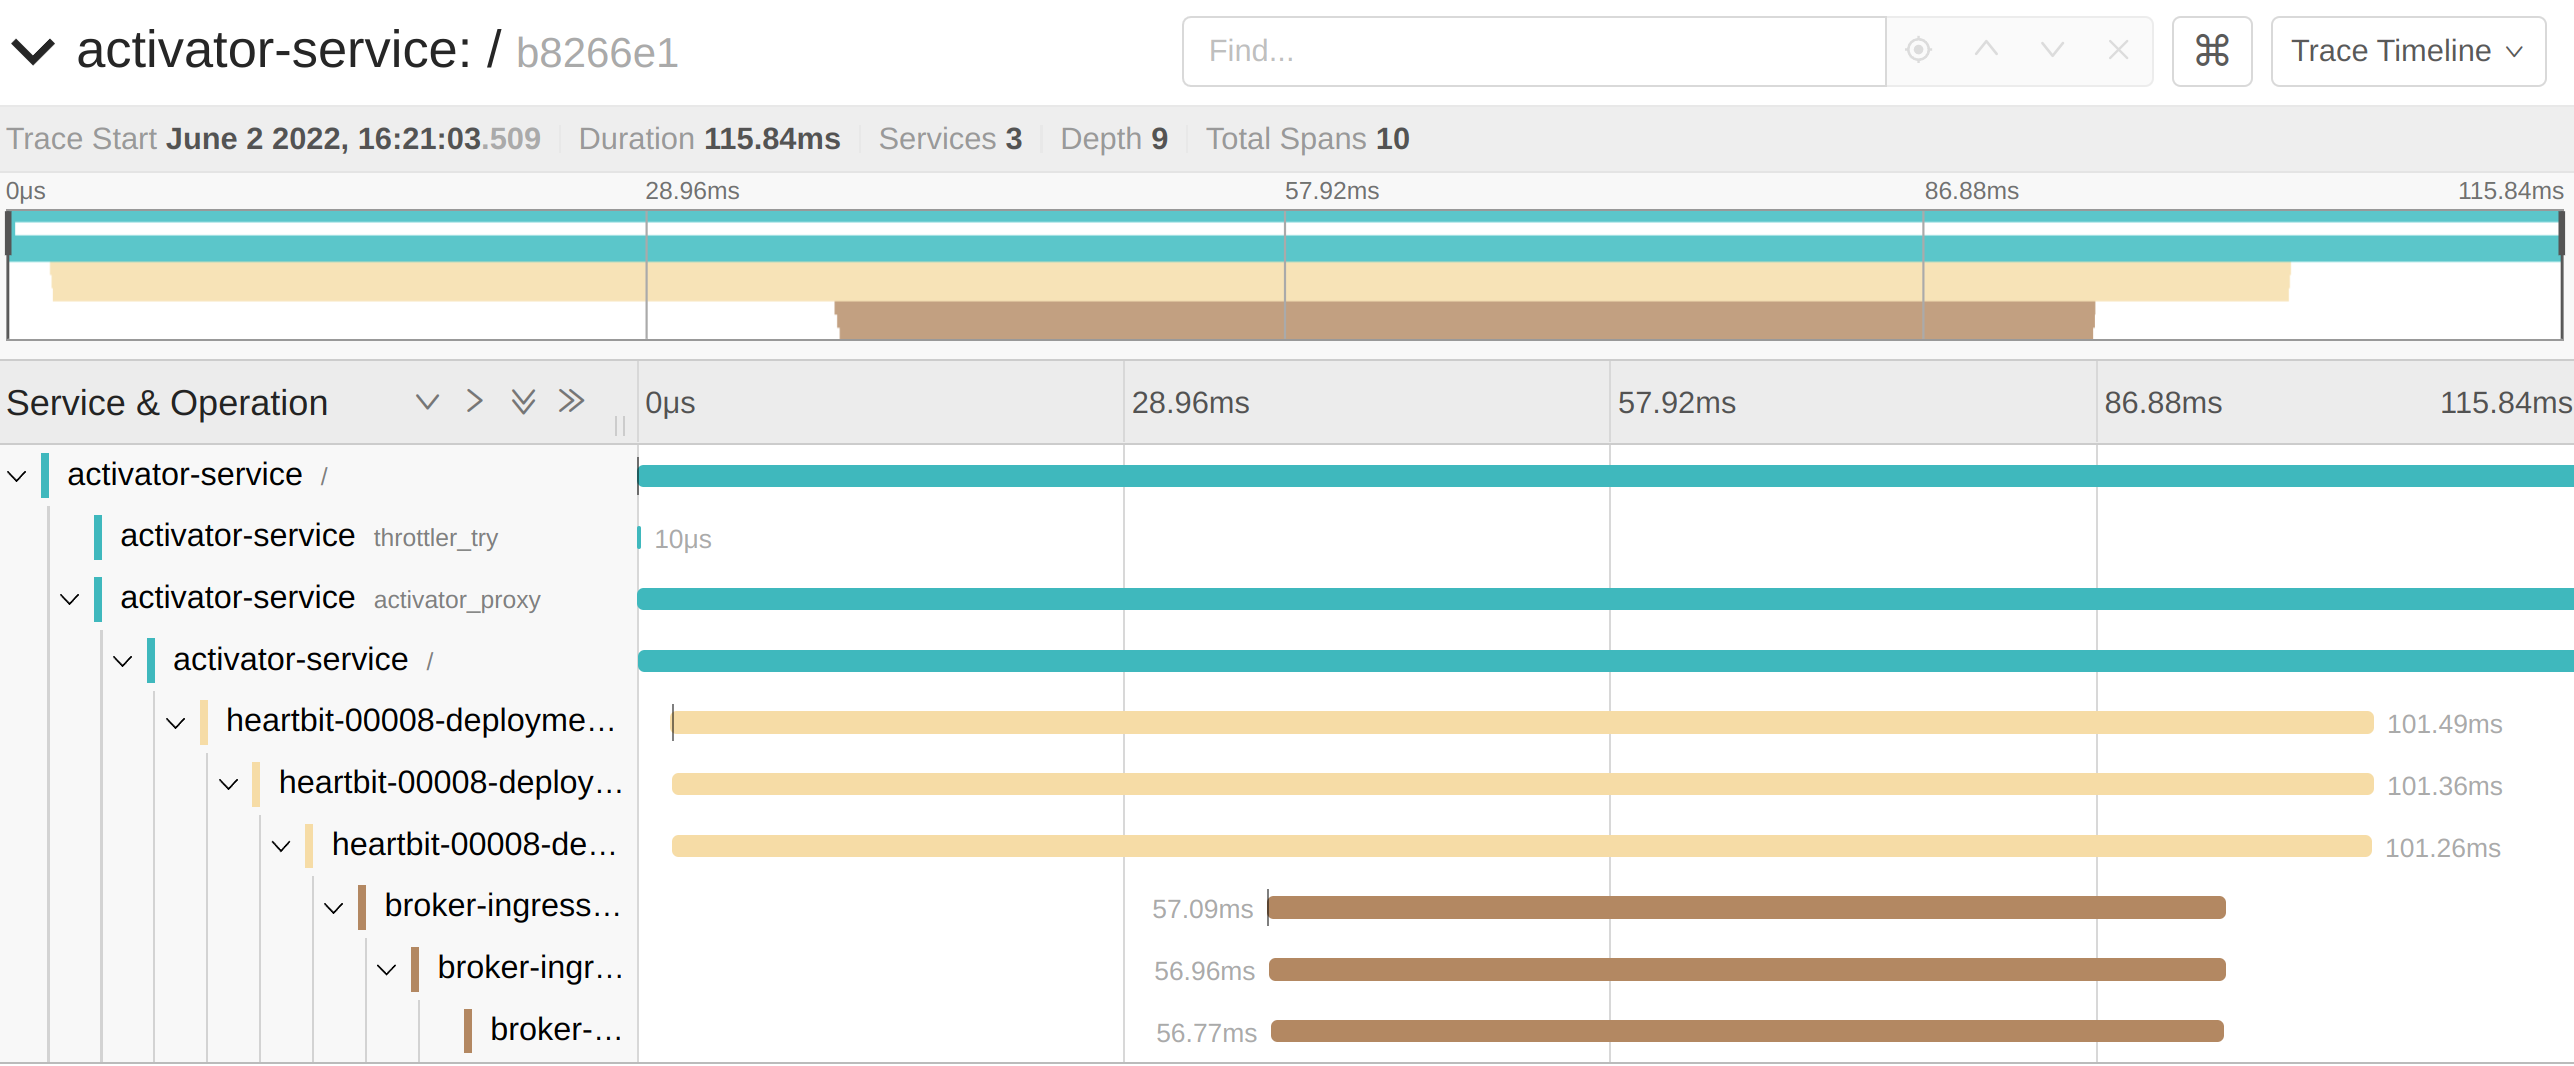
and
Trigger --(ce)--> EventDisplay ksvc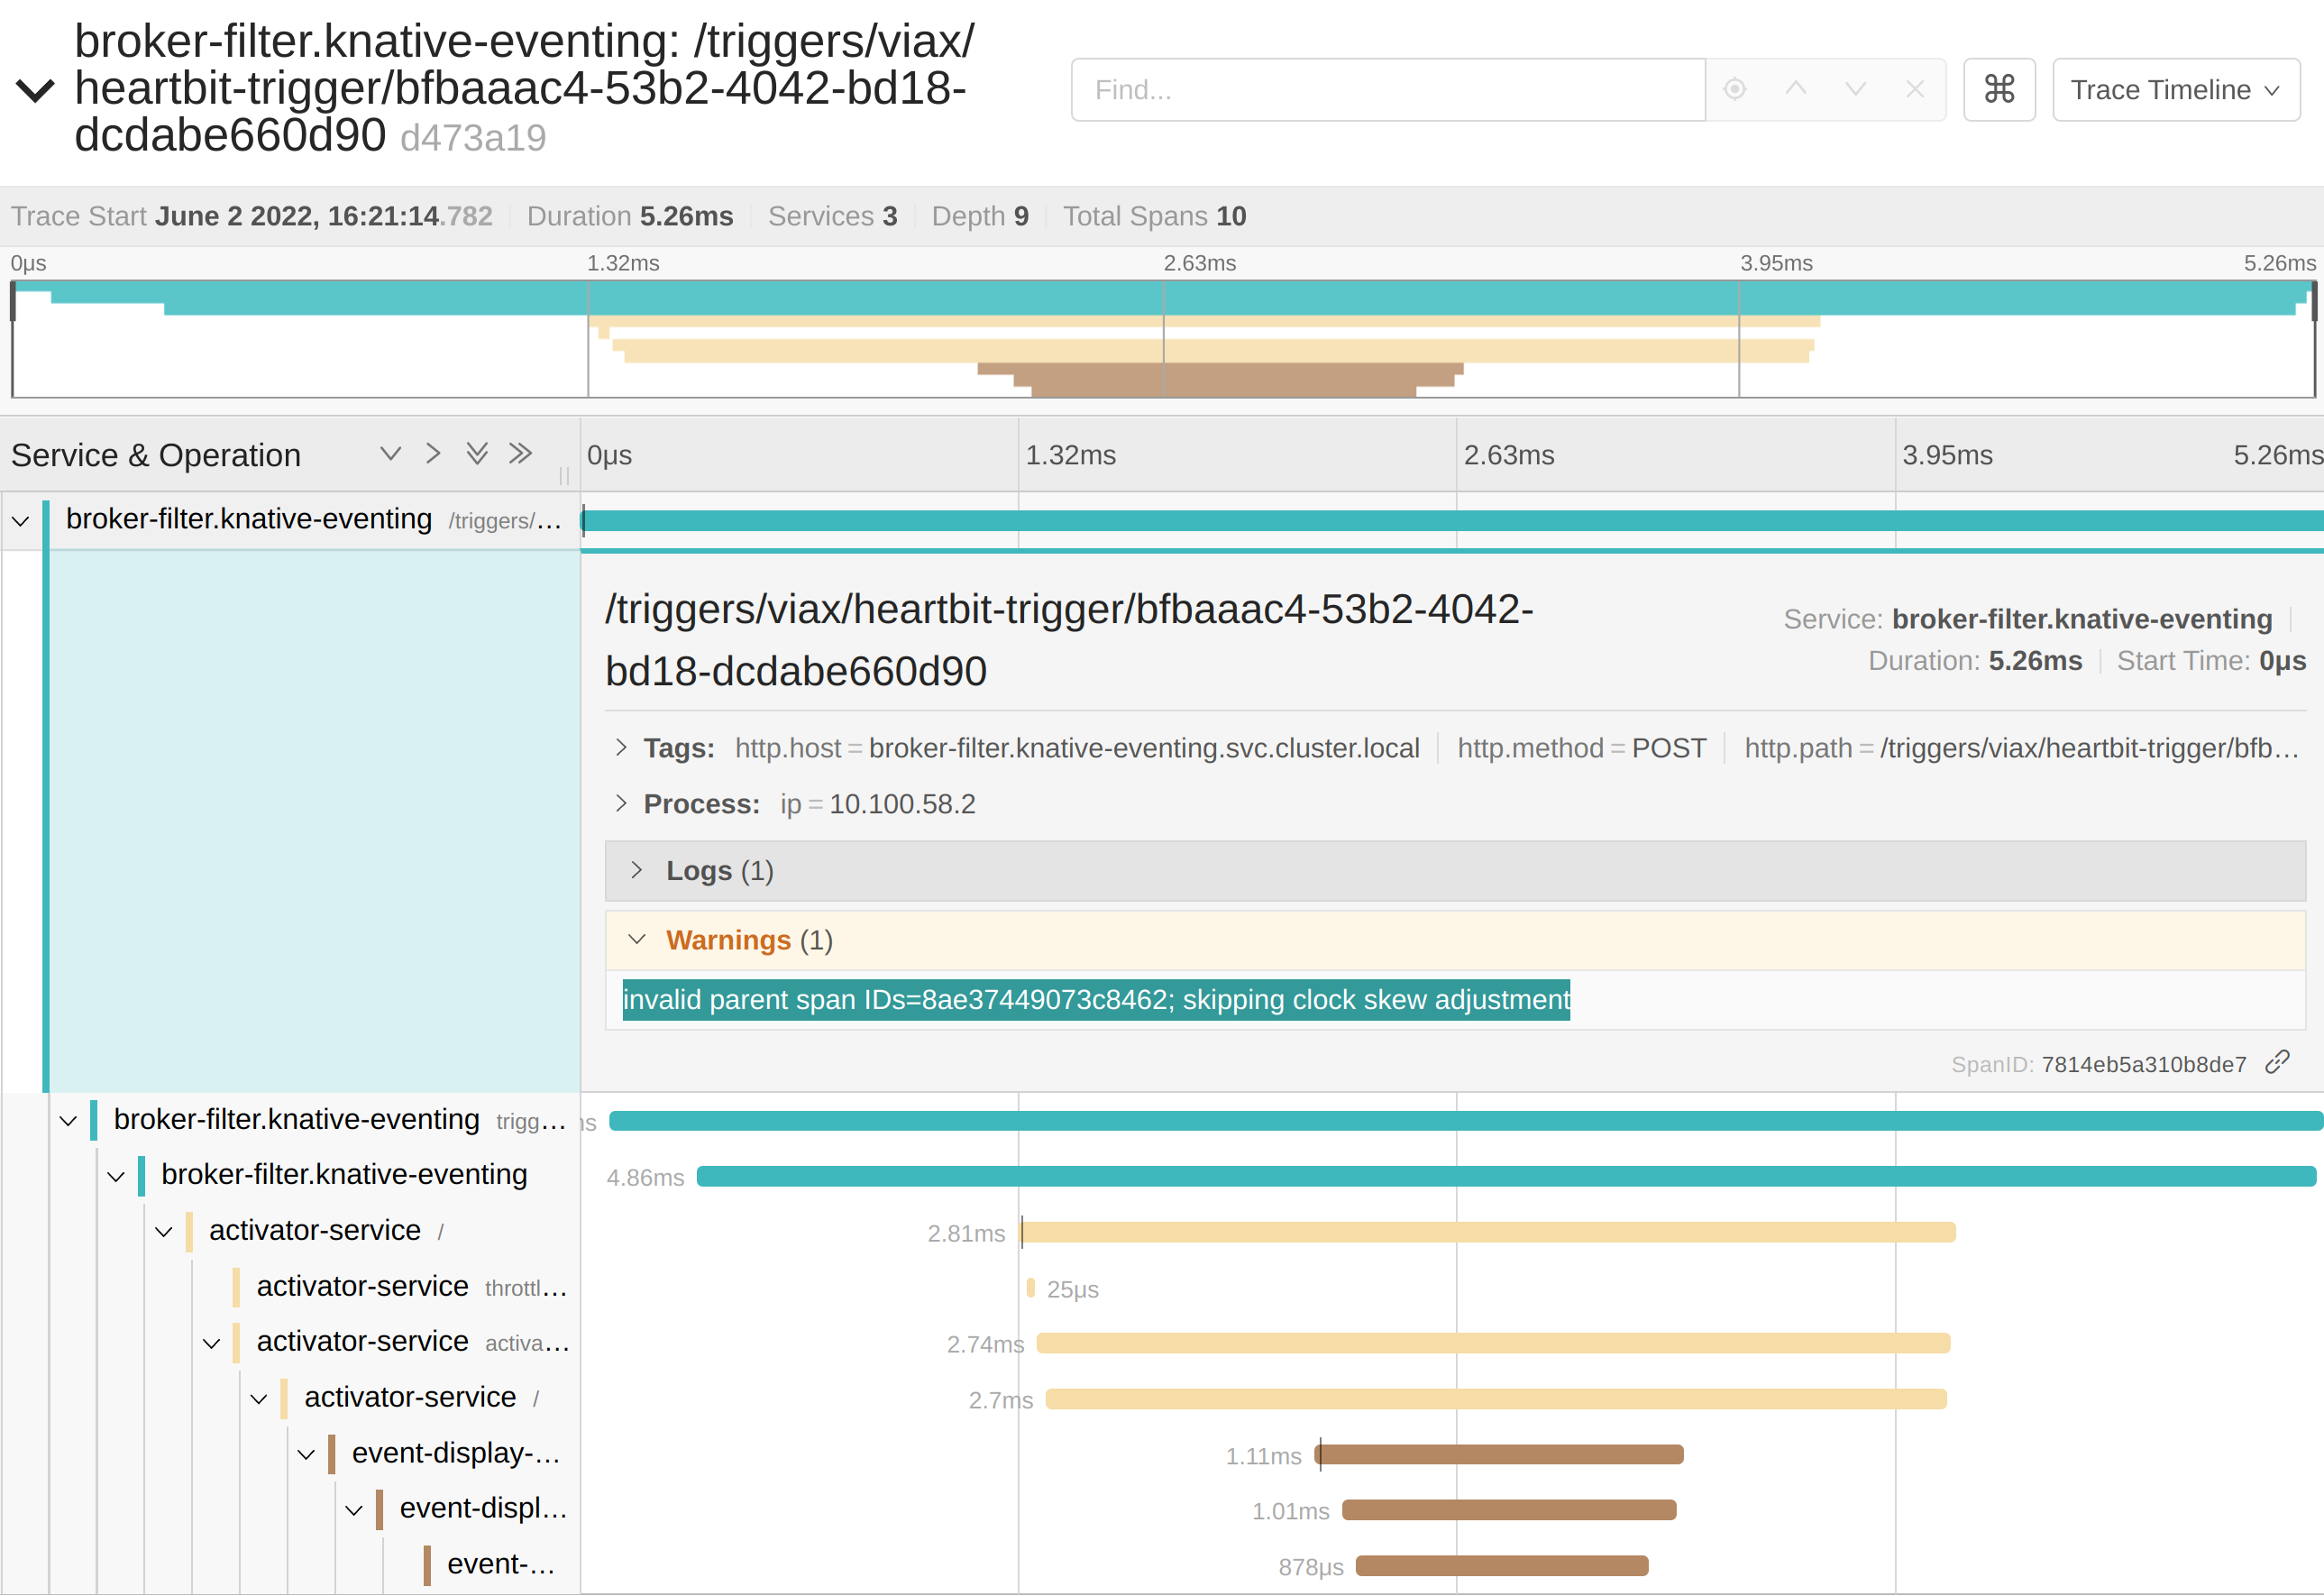
If I look at the 2nd trace (starting from Trigger) then I see that there are no tracing headers and I see a warning (which says about it):
> invalid parent span IDs=8ae37449073c8462; skipping clock skew adjustment
My question is why tracing headers are not passed to Trigger?
Is it related to backend channel implementation which is used by default (it our case it is NatssChannel) used by broker and triggers?

vil...@us.ibm.com
Jun 3, 2022, 9:11:47 AM6/3/22
to Knative Users
It might indeed be related to NatssChannel not supporting tracing.
NatssChannel is unfortunately not a maintained backend implementation. If anyone is interested in contributing, please don't hesitate to contact us, either on Slack, email or DM me.
Lionel
Andrey Stelmashenko
Jun 7, 2022, 3:03:43 AM6/7/22
to Knative Users
Hey,
Do anybody know about other nats channels, nats and jetstream do those support tracing headers?Andrey Stelmashenko
Jul 26, 2022, 4:34:59 AM7/26/22
to Knative Users
For those who may be interested, natss-channels based broker did not support tracing header propagation and exporting. This has been fixed by PR https://github.com/knative-sandbox/eventing-natss/pull/342
It is not released yet (v1.4). The next release will include it.
Reply all
Reply to author
Forward
0 new messages