Contact Map rendering
21 views
Skip to first unread message

Hector Medina
Mar 17, 2023, 6:22:23 PM3/17/23
to kappa-users
Hi folks,
I've added some advanced contact map rendering support to my tool suite, KaSaAn. While the circular layout done in the KaSim-in-browser is comprehensive, I have trouble reading that for large models. So I created a graphical language to describe these things, inspired from the potato-diagrams of old.
The tool suite also has a CLI script to read the contact map from witness files (aka "inputs.ka"), render them using different adapted algorithms, and add a very simple user interface to manually tweak the layout (polishing is best left to dedicated programs like Inkscape or Illustrator, but at least this is a quick way to render them).
An example of a default render of my large Wnt model:
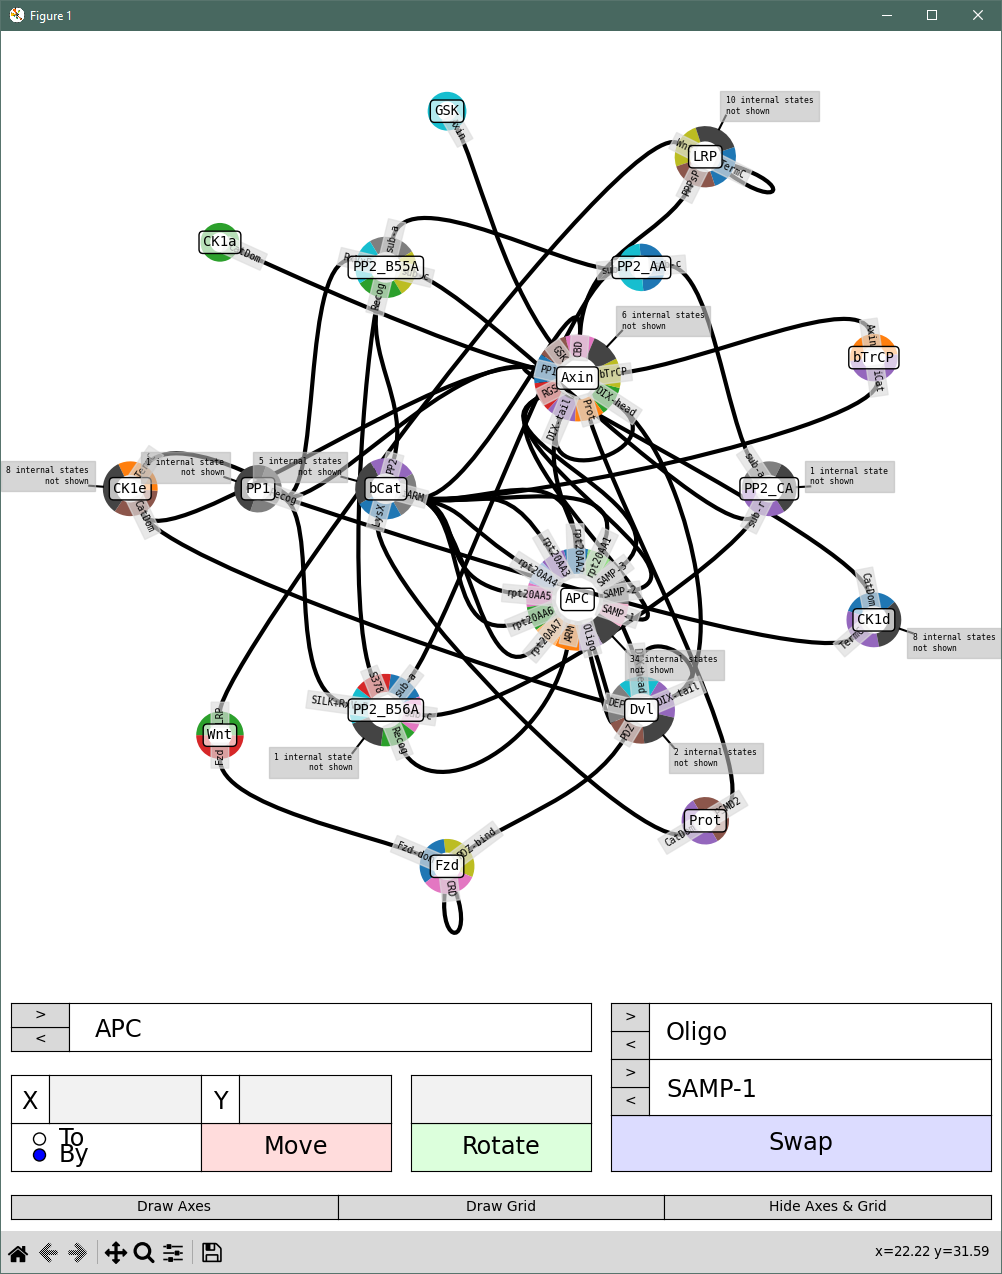
$ kappa_contact_map -m shell --summarize_flagpole -fs 10 10
The API is extensively documented, as is the script, so pass it the --help flag to display what's what..
~Hector
Reply all
Reply to author
Forward
0 new messages