Google Sheets - Creating Graphs with multiple lines
758 views
Skip to first unread message

Carol LaRow
Mar 14, 2016, 7:23:25 PM3/14/16
to Google Apps K12 Technical Forum
Need help with a Google Sheets Question:
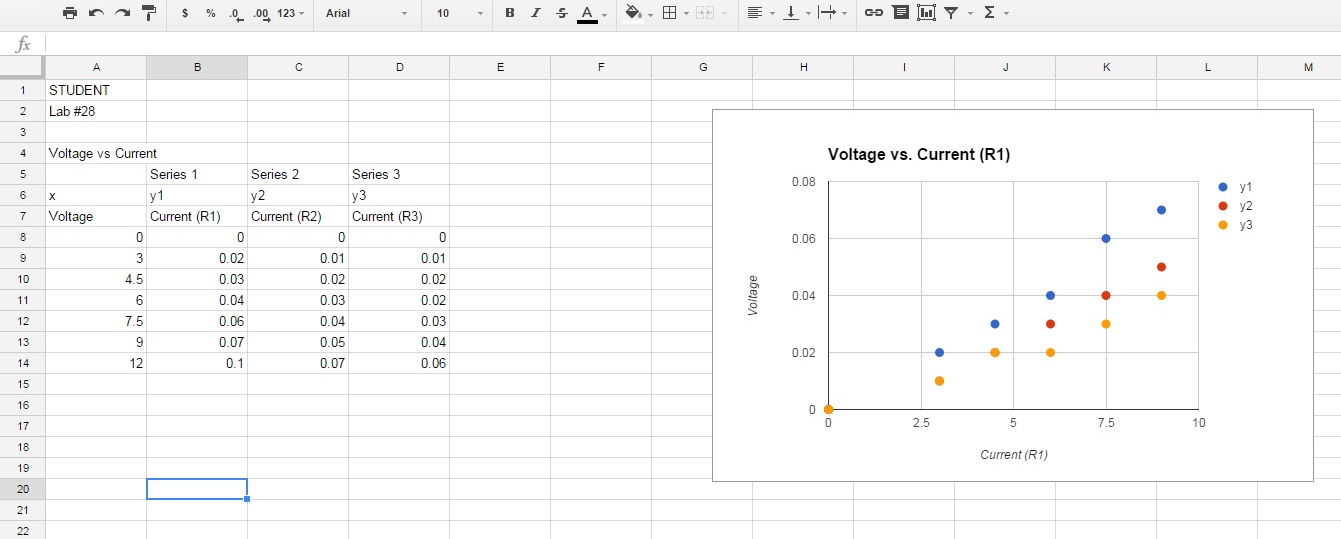
Attached is a picture of a possible set up for creating one graph with multiple lines (series) on one graph.
Attached is a picture of a possible set up for creating one graph with multiple lines (series) on one graph.
1) How can we add more than one line to a graph?
2) How can we switch or update the x-data or y-data?
In Excel you can simply right click on graph and click select data then a new window pops up showing the data series added to the graph. You then can edit each series or add more.
How can you do this in Google Sheets ?
What am I doing wrong?
Thank you,
Carol
Reply all
Reply to author
Forward
0 new messages