Understanding the Plotting Options
2,222 views
Skip to first unread message

John Lynch
Oct 21, 2013, 5:53:45 PM10/21/13
to julia...@googlegroups.com
It seems to me that there are three (four?) options for plotting:
- PyPlot
- Winston
- Gadfly
- Gaston
They all look great but I'm a little confused. I don't understand if there is a preference for any option (or is it up to the users to choose)? Is there a summary of differences?
How does Winston compare with Pyplot in capability?
I loved ggplot2 and think I might love Gadfly (based on initial experiments). What is Gadfly missing from ggplot2? Is it likely to come soon? Are there any intended variations? If I love Gadfly, when might I choose to use Winston instead?
Sorry about the number of questions.

asim
Oct 21, 2013, 7:47:48 PM10/21/13
to julia...@googlegroups.com
Hi
I am on the Mac, and have never been able to use any of these different plotting options. None of them get installed properly, despite many attempts over the past few months.
If anybody is successful on working with these on the Mac, it would be great to know.
Thanks
Asim

Roger Herikstad
Oct 21, 2013, 9:56:15 PM10/21/13
to julia...@googlegroups.com
Hi,
I have not been able to get Winston to work, and I haven't tried PyPlot or Gadfly, but Gaston works for me
julia> versioninfo()
Julia Version 0.2.0-prerelease+3865
Commit 5153a50* 2013-09-27 20:37:16 UTC
Platform Info:
  System: Darwin (x86_64-apple-darwin11.4.2)
  WORD_SIZE: 64
  BLAS: libopenblas (USE64BITINT DYNAMIC_ARCH NO_AFFINITY)
  LAPACK: libopenblas
LIBM: libopenlibmRoger-Herikstads-MacBook-Pro:~ roger$ gnuplot
G N U P L O T
Version 4.6 patchlevel 3 last modified 2013-04-12
Build System: Darwin x86_64
Copyright (C) 1986-1993, 1998, 2004, 2007-2013
Thomas Williams, Colin Kelley and many others
gnuplot home: http://www.gnuplot.info
faq, bugs, etc: type "help FAQ"
immediate help: type "help" (plot window: hit 'h')
Terminal type set to 'aqua'
Jason Merrill
Oct 21, 2013, 9:58:39 PM10/21/13
to julia...@googlegroups.com
On Monday, October 21, 2013 4:47:48 PM UTC-7, asim wrote:
HiI am on the Mac, and have never been able to use any of these different plotting options. None of them get installed properly, despite many attempts over the past few months.If anybody is successful on working with these on the Mac, it would be great to know.
Hi Asim,
I'm on a Mac, and I've had some success with PyPlot, Winston, and Gadfly, and never tried Gaston. The situation now seems significantly better than it was a the beginning of the summer.
My personal experience has been that Winston is the most stable/easy to set up. I just loaded it up with the latest julia master, and both the gui viewer through Winston.display(...) and saving a file through file(...) worked for me as detailed in the README.
Gadfly looks conceptually appealing to me, and has sometimes worked, but has often been broken in minor or major ways. Just now, when I try to draw to a png file, it's throwing some errors about forgetting to call g_type_init().
PyPlot is backed by matplotlib, which is getting pretty mature at this point, and has a lot of python users. You will need to get matplotlib on your system independently of installing the julia PyPlot package.
My advice would be to try Winston again on a recent version of Julia if you haven't had anything working recently. If it's still not working for you, I'd send a message with the specifics here, or at Winston's repo on github.
--Jason

Adrian Cuthbertson
Oct 22, 2013, 12:29:59 AM10/22/13
to julia...@googlegroups.com
I also battled (on Mountain Lion) to get the various plotting options working for ages, but then bit the bullet and completely removed macports from my system and switched to homebrew. Although it also involved a new install of the Latex live version directly as there is no homebrew version, this switch has been worth every hour spent on the effort. Generally now, I do not have any problems and am using Winston, Image, ImageView and PyPlot successfully.
Jason Merrill
Oct 22, 2013, 12:41:13 AM10/22/13
to julia...@googlegroups.com
On Monday, October 21, 2013 9:29:59 PM UTC-7, Adrian Cuthbertson wrote:
I also battled (on Mountain Lion) to get the various plotting options working for ages, but then bit the bullet and completely removed macports from my system and switched to homebrew. Although it also involved a new install of the Latex live version directly as there is no homebrew version, this switch has been worth every hour spent on the effort. Generally now, I do not have any problems and am using Winston, Image, ImageView and PyPlot successfully.
I can strongly second the suggestion to ditch macports if you've been using it and use homebrew instead. If you do that, be sure to follow the uninstall instructions for macports: https://www.macports.org/guide/chunked/installing.macports.uninstalling.html.

Billou Bielour
Oct 22, 2013, 6:07:30 AM10/22/13
to julia...@googlegroups.com
There's also ASCIIPlots, it's a bit less functional, but it should be easier to install:

Joonas Nättilä
Oct 22, 2013, 7:11:12 AM10/22/13
to julia...@googlegroups.com
Hi,
I just installed Winston from scratch today on OSX and fixed some bugs with the developers. In my opinion, the best way is to use the most recent version by doing
and then
After this, everything should work when you put
on top of your code.
What comes to different plotting systems, I think for now you should use PyPlot for all the advanced stuff and native Winston or Gadfly for some simple figures. We are currently working on adding some of the more advanced stuff to Winston so that it would be the only thing you ever need, but we aren't quite there yet.
I just installed Winston from scratch today on OSX and fixed some bugs with the developers. In my opinion, the best way is to use the most recent version by doing
Pkg.clone("https://github.com/nolta/Winston.jl.git")
and then
using Homebrew
Homebrew.add("pango")
After this, everything should work when you put
using Winston
on top of your code.
What comes to different plotting systems, I think for now you should use PyPlot for all the advanced stuff and native Winston or Gadfly for some simple figures. We are currently working on adding some of the more advanced stuff to Winston so that it would be the only thing you ever need, but we aren't quite there yet.

Stefan Karpinski
Oct 22, 2013, 7:25:34 AM10/22/13
to Julia Users
On Tue, Oct 22, 2013 at 7:11 AM, Joonas Nättilä <nattila...@gmail.com> wrote:
Pkg.clone("Winston") will also do the trick.
Pkg.clone("https://github.com/nolta/Winston.jl.git")
Pkg.clone("Winston") will also do the trick.
Joonas Nättilä
Oct 22, 2013, 9:15:45 AM10/22/13
to julia...@googlegroups.com
I think there has been a lot of discussion lately of different plotting systems as people are now starting to use julia for every task and need also a way to present their results. While it is great to have many options, the large number of different system can also be a drawback for users not familiar with all the different backends. Due to this, I think we should focus on one system and advertise this everywhere. Of course it would be best if this system would be written in julia itself and is actively maintained. This means that it should be either Winston or Gadfly then, as both are (as far as I know) able to produce publication quality figures quite easily.
I am, myself, at the moment writing a easy to use front end for Winston so that I could use it full time and be able to produce neat figures. Before this front end, we need to however add some major functionalities to the Winston itself, that takes time. In the meantime one has to use some other system such as PyPlot. This effectively leaves me with two plotting systems but hopefully in future I only need Winston for everything.
I am, myself, at the moment writing a easy to use front end for Winston so that I could use it full time and be able to produce neat figures. Before this front end, we need to however add some major functionalities to the Winston itself, that takes time. In the meantime one has to use some other system such as PyPlot. This effectively leaves me with two plotting systems but hopefully in future I only need Winston for everything.

RecentConvert
Oct 22, 2013, 9:45:12 AM10/22/13
to julia...@googlegroups.com
I am in a similar boat but after looking at the examples available for each I started testing PyPlot. The others just don't look like they have a very rich set of capabilities. It helps too that our group has a fair amount of Matlab experience and PyPlot is similar, at least a basic level.
Even though it shares similarities with Matlab it has still been a huge pain to do anything more advanced. As I learn more I'll post functional examples and eventually add them to some cookbook collection of such examples.
Even though it shares similarities with Matlab it has still been a huge pain to do anything more advanced. As I learn more I'll post functional examples and eventually add them to some cookbook collection of such examples.

Tim Holy
Oct 22, 2013, 11:49:35 AM10/22/13
to julia...@googlegroups.com
On Tuesday, October 22, 2013 06:15:45 AM Joonas Nättilä wrote:
>While it is great to have many
> options, the large number of different system can also be a drawback for
> users not familiar with all the different backends. Due to this, I think we
> should focus on one system and advertise this everywhere.
I like this idea overall, but it's difficult when all existing options have
>While it is great to have many
> options, the large number of different system can also be a drawback for
> users not familiar with all the different backends. Due to this, I think we
> should focus on one system and advertise this everywhere.
strengths and weaknesses. I doubt we even have the core graphics
infrastructure right, let alone any consensus on a favorite plotting
interface. I suspect we should actively promote the success of both Gadfly and
Winston, at a minimum, and be grateful for the rest as "stopgaps" in the
meantime.
This morning I did some very simple benchmarking, since I think performance
will matter a lot. The test case: plotting a line, without markers, of the
form
x = 1:10^5
y = rand(length(x))
I don't think of this as particularly large (we should darn-well be able to do
even bigger datasets), but it's big enough to push the system. Nothing
performed flawlessly. The test was purely qualitative, and all I evaluated was
(1) how quickly the graph appeared, and (2) the experience in resizing the
window. Note this isn't really testing _plotting_, it's testing _graphics_.
Important detail: on my system the native Cairo library suffered from the issue
here:
https://groups.google.com/d/msg/julia-users/oNPhJ9iHIDY/CP6oBgPq2SQJ
and so this was done with a hand-built version that performed better:
https://groups.google.com/d/msg/julia-users/oNPhJ9iHIDY/GpV7SJUgO50J
Results, very qualitative, on my wimpy laptop:
- Matlab (for comparison): window pops up in ~0.7 seconds. Resize behavior is
"interesting:" it's fluid to drag a corner of the window to resize it, but the
plot only updates when you let go. While this is slightly odd, on balance it
generated the second-most pleasant behavior I experienced (and would have been
the most pleasant if I had chosen 10^6 points rather than 10^5).
- Winston, with either the Tk or Gtk backend (I couldn't tell any difference):
roughly 1 second to show the graph on the screen (definitely slower than
Matlab, but not ridiculously so). Resize performance is a little frustrating
but tolerable. It doesn't use the Matlab trick, so the window shape jerks from
one to the next between ~1s updates.
- Gadfly, rendering to an SVG file (I couldn't get the D3->browser interface
https://github.com/dcjones/Gadfly.jl#using-the-d3-backend
to work for me, otherwise the results might have been different): about 2.5s to
write the file. Not sure whether viewer time is relevant, but the one I used
(Gwenview) had seconds-long rendering times.
- Gadfly, through IJulia: completely unusable. Gadfly finished its job quickly
(_well_ under a second, didn't time it because it was fast), but on my system
chrome was running 1 CPU at 100% for the next 60 seconds or more before finally
rendering the image. Scrolling the browser window then became impossible. Even
10^4 points takes several seconds.
- Gaston: gaston finishes its job quickly (~0.1s), but the window doesn't pop
up in gnuplot for another 3-4 seconds. Resizing the window seems basically
impossible.
- PyPlot: quite similar to Winston. Slightly worse resize performance, but
nothing too dramatic.
I also tested another contender, Qwt, modifying the "curvdemo1" example (code
below). Even including the time to launch from a bash prompt and generate the
random numbers (something that wasn't in any of the other tests), it was by
far the fastest to render (< 0.25 seconds) and had by far the most pleasant
resize experience (although you could perceive some lag, which grew quite bad
when I increased the number of points to 10^6, at which point it was less
pleasant than Matlab to resize the window).
Overall, with the possible exception of Qwt (and Matlab :) ) it's not exactly
a pretty picture. Personally I see a few ways forward (again, I'm just talking
graphics, not plotting):
- Live with Cairo's current performance, eventually adopting Gtk over Tk. This
would not be a disaster, but probably doesn't qualify as awesome.
- Figure out why Cairo's performance stinks compared to Qwt/Qt's, and fix it.
- Experiment with Cairogles: https://github.com/SRA-SiliconValley/cairogles
- See whether D3 coupled with Gadfly writing its results to a ramdisk like
/dev/shm fixes things. Big possible problem here (others will have to inform
me): can we build GUIs and get interactivity, with _julia_ function callbacks,
this way?
- Adopt Qt and possibly Qwt (huge negative: a massive number of callback
functions would currently be required)
- Adopt QML, http://qt-project.org/doc/qt-5.1/qtdoc/qtquick-
applicationdevelopers.html, a sort of javascript-like scene description
language (it's a declarative, not imperative, way of setting up GUIs). This
would require some wrappers (but perhaps far fewer than wrapping classic Qt),
would mean that we'd write GUI "button logic" in QML, and perhaps we'd use
jlapi.c to create julia callbacks (I _think_ we could set up a strategy to
avoid the need for end-users to compile anything, but I'm not certain). There
are some scary steps in adopting this route because there's a lot uncertain
and untested (I suspect this would qualify as "bleeding edge"), and some
serious potential negatives for remote-server operation (such as likely
requiring VirtualGL, gack). On the plus side, I've played a bit with its
graphics over the last few days; suffice it to say that if you want rather
amazing eye candy with impressive performance, this route appears to have a
few advantages :-).
Not sure what to do here. I wonder if Cairogles might be the best choice
(although it too might require VirtualGL, unless it has a non-OpenGL
fallback).
Best,
--Tim
Qwt demo (place in the curvdemo1 directory; tested on 6.0, since that's what I
had pre-installed):
#include <qwt_scale_map.h>
#include <qwt_plot_curve.h>
#include <qwt_symbol.h>
#include <qwt_math.h>
#include <qcolor.h>
#include <qpainter.h>
#include <qapplication.h>
#include <qframe.h>
#include <stdlib.h>
//------------------------------------------------------------
// curvdemo1
//
// This example program features some of the different
// display styles of the QwtPlotCurve class
//------------------------------------------------------------
//
// Array Sizes
//
const int Size = 100000;
const int CurvCnt = 1;
//
// Arrays holding the values
//
double xval[Size];
double yval[Size];
QwtScaleMap xMap;
QwtScaleMap yMap;
class MainWin : public QFrame
{
public:
MainWin();
protected:
virtual void paintEvent( QPaintEvent * );
void drawContents( QPainter *p );
private:
void shiftDown( QRect &rect, int offset ) const;
QwtPlotCurve d_curves[CurvCnt];
};
MainWin::MainWin()
{
int i;
xMap.setScaleInterval( -0.5, 10.5 );
yMap.setScaleInterval( -1.1, 1.1 );
//
// Frame style
//
setFrameStyle( QFrame::Box | QFrame::Raised );
setLineWidth( 2 );
setMidLineWidth( 3 );
//
// Calculate values
//
for( i = 0; i < Size; i++ )
{
xval[i] = double( i ) * 10.0 / double( Size - 1 );
//yval[i] = qSin( xval[i] ) * qCos( 2.0 * xval[i] );
yval[i] = drand48();
}
//
// define curve styles
//
i = 0;
d_curves[i].setPen( QColor( Qt::darkBlue ) );
d_curves[i].setStyle( QwtPlotCurve::Lines );
d_curves[i].setRenderHint( QwtPlotItem::RenderAntialiased );
i++;
//
// attach data
//
for( i = 0; i < CurvCnt; i++ )
d_curves[i].setRawSamples( xval, yval, Size );
}
void MainWin::shiftDown( QRect &rect, int offset ) const
{
rect.translate( 0, offset );
}
void MainWin::paintEvent( QPaintEvent *event )
{
QFrame::paintEvent( event );
QPainter painter( this );
painter.setClipRect( contentsRect() );
drawContents( &painter );
}
//
// REDRAW CONTENTS
//
void MainWin::drawContents( QPainter *painter )
{
int deltay, i;
QRect r = contentsRect();
deltay = r.height() / CurvCnt - 1;
r.setHeight( deltay );
//
// draw curves
//
for ( i = 0; i < CurvCnt; i++ )
{
xMap.setPaintInterval( r.left(), r.right() );
yMap.setPaintInterval( r.top(), r.bottom() );
painter->setRenderHint( QPainter::Antialiasing,
d_curves[i].testRenderHint( QwtPlotItem::RenderAntialiased ) );
d_curves[i].draw( painter, xMap, yMap, r );
}
//
// draw titles
//
r = contentsRect(); // reset r
painter->setFont( QFont( "Helvetica", 8 ) );
const int alignment = Qt::AlignTop | Qt::AlignHCenter;
painter->setPen( Qt::black );
painter->drawText( 0 , r.top(), r.width(), painter-
>fontMetrics().height(),
alignment, "Style: Lines, Symbol: None" );
}
int main ( int argc, char **argv )
{
QApplication a( argc, argv );
MainWin w;
w.resize( 300, 600 );
w.show();
return a.exec();
}

Daniel Jones
Oct 22, 2013, 1:20:28 PM10/22/13
to julia...@googlegroups.com
Hey John,
To answer your original questions about Gadfly: there's still a fair amount in ggplot2 that can't be reproduced Gadfly. I'm generally trying to prioritize the most useful, or most difficult to implement features. I have lot of what I think is the most useful parts of ggplot2 now, but usefulness is subjective, so please do make requests in the bug tracker if there's something you can't find a way to do. I will get to it eventually.
As for variations, I think Gadfly will be pretty familiar to ggplot2 users, but it's not indented as a reimplementation. There are a lot of small differences (some things have different names, the way the plot function works is fairly different), and a few bigger ones (e.g. there are subplots in gadfly, rather than facets).

Sven Mesecke
Oct 22, 2013, 3:43:33 PM10/22/13
to julia...@googlegroups.com
John,
I played with some of these different options (Winston and Gadfly) on a mac in the last couple of weeks and wrote up my experiences in a couple of blog posts (the first one to be found here: http://sveme.org/installing-julia-for-data-visualization-stuff.html and here http://sveme.org/julia-for-matlab-users-i.html). The key differences between the options have been mentioned before, but those posts will give you some idea about the coding style involved in using these options so that you might get a better idea.
Best,
Sven
John Lynch
Oct 22, 2013, 6:24:51 PM10/22/13
to julia...@googlegroups.com
Thanks for that Tim, Daniel, Sven,
I now feel like I have an overview of where things fit. That is an excellent set of tutorial's Sven. I really enjoyed them. Your evaluation was very interesting Tim - a bit of work still.
For now I plan to focus on two strategies: learning to use Gadfly effectively and using PyPlot. I really like the GofG approach plus Daniel's implementation and Sven illustrates its elegance in his blog. If I run into to things that would be useful and are not being developed I will flag them on the bug tracker. I will continue with PyPlot because i perceive it to be similar to Winston and, given my need to use it in Python, its a lower effort approach.
So thanks very much for the help.

Blake Johnson
Oct 23, 2013, 9:31:31 AM10/23/13
to julia...@googlegroups.com
It would be interesting to see how ContinuumIO's Bokeh would do on your test. Has anyone here played with it yet?
Tim Holy
Oct 24, 2013, 6:11:45 AM10/24/13
to julia...@googlegroups.com
On Wednesday, October 23, 2013 06:31:31 AM Blake Johnson wrote:
> It would be interesting to see how ContinuumIO's Bokeh would do on your
> test. Has anyone here played with it yet?
I've not. But fundamentally this seems to be about the graphics library
> It would be interesting to see how ContinuumIO's Bokeh would do on your
> test. Has anyone here played with it yet?
performance rather than the plotting infrastructure. In none of these cases
does the Julia code take any appreciable time, it's all spent waiting for the
renderer to do its job, and too many of the renderers are frustratingly slow
(at least, on my machine). That's why I think we need to choose the graphics
back end very carefully.
Two minor updates:
(1) having Winston turn off antialiasing doesn't seem to help (although I kind
of like the fonts better that way, especially when the window gets small)
(2) HTML5's <canvas> element, rendered by chrome, seems to blow Cairo/Tk out
of the water, at least in terms of the speed with which the graph appears.
(This also indicates that the Gadfly/IJulia combination might be able to be
improved substantially.) I haven't gotten resizing to work yet, so this is a
very incomplete test; however, just hitting "refresh" on the browser finishes
an update in roughly 0.3secs on my machine (roughly 3-4x better than
Cairo/Tk), and that's including parsing, generating new random numbers, etc.
So this seems basically as good as Qt. Code is pasted below (slightly tweaked
from http://www.html5canvastutorials.com/labs/html5-canvas-graphing-an-
equation/).
Given the highly-variable performance using the native Cairo libraries across
different machines, it's possible that my library-build fix (see link in my
earlier post) might have been beneficial but still not complete. It would be
interesting to find out what other people get when they try plotting
x = 1:10^5
y = rand(length(x))
in Winston, and then try resizing the window. Is it snappy for anyone?
y = rand(length(x))
--Tim
HTML5 canvas example, graphing 10^5 random points:
<!DOCTYPE HTML>
<html>
<head>
<style>
body {
margin: 0px;
padding: 0px;
}
</style>
</head>
<body>
<canvas id="myCanvas" width="578" height="300"></canvas>
<script>
function Graph(config) {
// user defined properties
this.canvas = document.getElementById(config.canvasId);
this.minX = config.minX;
this.minY = config.minY;
this.maxX = config.maxX;
this.maxY = config.maxY;
this.unitsPerTick = config.unitsPerTick;
// constants
this.axisColor = '#aaa';
this.font = '8pt Calibri';
this.tickSize = 20;
// relationships
this.context = this.canvas.getContext('2d');
this.rangeX = this.maxX - this.minX;
this.rangeY = this.maxY - this.minY;
this.unitX = this.canvas.width / this.rangeX;
this.unitY = this.canvas.height / this.rangeY;
this.centerY = Math.round(Math.abs(this.minY / this.rangeY) *
this.canvas.height);
this.centerX = Math.round(Math.abs(this.minX / this.rangeX) *
this.canvas.width);
this.iteration = (this.maxX - this.minX) / 100000;
this.scaleX = this.canvas.width / this.rangeX;
this.scaleY = this.canvas.height / this.rangeY;
// draw x and y axis
this.drawXAxis();
this.drawYAxis();
}
Graph.prototype.drawXAxis = function() {
var context = this.context;
context.save();
context.beginPath();
context.moveTo(0, this.centerY);
context.lineTo(this.canvas.width, this.centerY);
context.strokeStyle = this.axisColor;
context.lineWidth = 2;
context.stroke();
// draw tick marks
var xPosIncrement = this.unitsPerTick * this.unitX;
var xPos, unit;
context.font = this.font;
context.textAlign = 'center';
context.textBaseline = 'top';
// draw left tick marks
xPos = this.centerX - xPosIncrement;
unit = -1 * this.unitsPerTick;
while(xPos > 0) {
context.moveTo(xPos, this.centerY - this.tickSize / 2);
context.lineTo(xPos, this.centerY + this.tickSize / 2);
context.stroke();
context.fillText(unit, xPos, this.centerY + this.tickSize / 2 + 3);
unit -= this.unitsPerTick;
xPos = Math.round(xPos - xPosIncrement);
}
// draw right tick marks
xPos = this.centerX + xPosIncrement;
unit = this.unitsPerTick;
while(xPos < this.canvas.width) {
context.moveTo(xPos, this.centerY - this.tickSize / 2);
context.lineTo(xPos, this.centerY + this.tickSize / 2);
context.stroke();
context.fillText(unit, xPos, this.centerY + this.tickSize / 2 + 3);
unit += this.unitsPerTick;
xPos = Math.round(xPos + xPosIncrement);
}
context.restore();
};
Graph.prototype.drawYAxis = function() {
var context = this.context;
context.save();
context.beginPath();
context.moveTo(this.centerX, 0);
context.lineTo(this.centerX, this.canvas.height);
context.strokeStyle = this.axisColor;
context.lineWidth = 2;
context.stroke();
// draw tick marks
var yPosIncrement = this.unitsPerTick * this.unitY;
var yPos, unit;
context.font = this.font;
context.textAlign = 'right';
context.textBaseline = 'middle';
// draw top tick marks
yPos = this.centerY - yPosIncrement;
unit = this.unitsPerTick;
while(yPos > 0) {
context.moveTo(this.centerX - this.tickSize / 2, yPos);
context.lineTo(this.centerX + this.tickSize / 2, yPos);
context.stroke();
context.fillText(unit, this.centerX - this.tickSize / 2 - 3, yPos);
unit += this.unitsPerTick;
yPos = Math.round(yPos - yPosIncrement);
}
// draw bottom tick marks
yPos = this.centerY + yPosIncrement;
unit = -1 * this.unitsPerTick;
while(yPos < this.canvas.height) {
context.moveTo(this.centerX - this.tickSize / 2, yPos);
context.lineTo(this.centerX + this.tickSize / 2, yPos);
context.stroke();
context.fillText(unit, this.centerX - this.tickSize / 2 - 3, yPos);
unit -= this.unitsPerTick;
yPos = Math.round(yPos + yPosIncrement);
}
context.restore();
};
Graph.prototype.drawEquation = function(equation, color, thickness) {
var context = this.context;
context.save();
context.save();
this.transformContext();
context.beginPath();
context.moveTo(this.minX, equation(this.minX));
for(var x = this.minX + this.iteration; x <= this.maxX; x +=
this.iteration) {
context.lineTo(x, equation(x));
}
context.restore();
context.lineJoin = 'round';
context.lineWidth = thickness;
context.strokeStyle = color;
context.stroke();
context.restore();
};
Graph.prototype.drawRandom = function(color, thickness) {
var context = this.context;
context.save();
context.save();
this.transformContext();
context.beginPath();
context.moveTo(this.minX, this.centerY);
for(var x = this.minX + this.iteration; x <= this.maxX; x +=
this.iteration) {
context.lineTo(x, Math.random());
}
context.restore();
context.lineJoin = 'miter';
context.lineWidth = thickness;
context.strokeStyle = color;
context.stroke();
context.restore();
};
Graph.prototype.transformContext = function() {
var context = this.context;
// move context to center of canvas
this.context.translate(this.centerX, this.centerY);
/*
* stretch grid to fit the canvas window, and
* invert the y scale so that that increments
* as you move upwards
*/
context.scale(this.scaleX, -this.scaleY);
};
var myGraph = new Graph({
canvasId: 'myCanvas',
minX: -10,
minY: -1,
maxX: 10,
maxY: 1,
unitsPerTick: 1
});
myGraph.drawRandom('green', 1);
// myGraph.drawEquation(function(x) {
// return 5 * Math.sin(x);
// }, 'green', 3);
// myGraph.drawEquation(function(x) {
// return x * x;
// }, 'blue', 3);
//
// myGraph.drawEquation(function(x) {
// return 1 * x;
// }, 'red', 3);
</script>
</body>
</html>
Tim Holy
Oct 24, 2013, 7:46:12 AM10/24/13
to julia...@googlegroups.com
Actually, we can quantify the previous tests. To be explicit, anyone who's interested in this issue might want to do the following simple comparison.
In Julia:
using Winston
x = 1:10^5
plot(x,rand(length(x)))
@time plot(x,rand(length(x)))
And then load the slightly-modified script attached to this message into your browser; it will report its own execution time.
I had estimated the HTML5 canvas time quite accurately, but I had underestimated just how slow Tk/Cairo was:
HTML5/chromium (from Kubuntu 12.04): ~0.33 sec
Tk/Cairo: ~2.6 sec
So it's almost a factor of 8, and was something like 10-fold slower than Qt. No wonder they felt so different from each other.
Profiling shows that most of the time is spent inside a poll function called by libtk->libx11->libxcb->libc. My Tk is version 8.5.
I now think my test with Gtk must not have been real, because trying that again shows that it isn't currently working. Perhaps Gtk will offer a way out?
--Tim

Chris Foster
Oct 24, 2013, 8:45:06 AM10/24/13
to julia...@googlegroups.com
On Thu, Oct 24, 2013 at 9:46 PM, Tim Holy <tim....@gmail.com> wrote:
> I had estimated the HTML5 canvas time quite accurately, but I had underestimated just how slow Tk/Cairo was:
> HTML5/chromium (from Kubuntu 12.04): ~0.33 sec
HTML5/firefox 24 (ubuntu 12.04) took > 60 sec, and I gave up waiting
> I had estimated the HTML5 canvas time quite accurately, but I had underestimated just how slow Tk/Cairo was:
> HTML5/chromium (from Kubuntu 12.04): ~0.33 sec
for it. Reducing to 40000 segments took 13 sec, and 10000 segments
took 1.1 sec, which exposes a strange nonlinear scaling for large
numbers of segments.
Winston took 113 sec to plot 10^5 segments and 1 sec for 10^4
segments, which is really quite slow. It's also suspiciously very
similar to the firefox timings; a quick search indicates firefox may
be using cairo internally, which would probably explain the
similarity.
~Chris

Patrick O'Leary
Oct 24, 2013, 10:14:26 AM10/24/13
to julia...@googlegroups.com
On Thursday, October 24, 2013 7:45:06 AM UTC-5, Chris Foster wrote:
Winston took 113 sec to plot 10^5 segments and 1 sec for 10^4
segments, which is really quite slow. It's also suspiciously very
similar to the firefox timings; a quick search indicates firefox may
be using cairo internally, which would probably explain the
similarity.
Check AzureCanvasBackend in about:support to see which renderer Firefox is using for canvases.
Tim Holy
Oct 24, 2013, 10:38:37 AM10/24/13
to julia...@googlegroups.com, Patrick O'Leary
webkit/qt browser like chromium is fast, as least for me.
I think this is the same issue with the stock cairo library as described here:
https://groups.google.com/d/msg/julia-users/oNPhJ9iHIDY/CP6oBgPq2SQJ
with a "solution" here:
https://groups.google.com/d/msg/julia-users/oNPhJ9iHIDY/GpV7SJUgO50J
firefox is presumably using the distribution-provided cairo.
--Tim

Jameson Nash
Oct 24, 2013, 11:40:36 AM10/24/13
to julia...@googlegroups.com, Patrick O'Leary
I'm curious if you switch the Cairo backend to RGB in Tk (instead of platform-accelerated) if this gets much faster. Anyone want to test? The code to do this should be very easy.
I'm not sure why the Gtk backend would be broken. I didn't think any of the dependencies have changed recently.
Tim Holy
Oct 24, 2013, 12:21:05 PM10/24/13
to julia...@googlegroups.com
On Thursday, October 24, 2013 11:40:36 AM Jameson Nash wrote:
> I'm curious if you switch the Cairo backend to RGB in Tk (instead of
> platform-accelerated) if this gets much faster. Anyone want to test? The
> code to do this should be very easy.
Happy to. I'm guessing it's the set of constants supplied to the jl_tkwin*
> I'm curious if you switch the Cairo backend to RGB in Tk (instead of
> platform-accelerated) if this gets much faster. Anyone want to test? The
> code to do this should be very easy.
functions? Where do those constants come from, and what is the right setting?
(In their current in-code form they're rather opaque.)
> I'm not sure why the Gtk backend would be broken. I didn't think any of the
> dependencies have changed recently.
use the system cairo library, it does not segfault, but it suffers from that
same ridiculously-slow performance that is plaguing Chris, me, and others
(it's not just ubuntu, see the old thread).
But I have a CentOS machine that doesn't suffer this problem. I benchmarked it
with Gtk (checked out master). I get this:
julia> ERROR: ccall: could not find function gdk_window_create_similar_surface
in library libgdk-x11-2.0
in cairo_surface_for at /usr/local/julia/julia-packages/Gtk/src/cairo.jl:76
ERROR: access to undefined reference
in canvas_on_expose_event at /usr/local/julia/julia-
packages/Gtk/src/cairo.jl:92
$ cat /etc/*release
CentOS release 6.4 (Final)
LSB_VERSION=base-4.0-amd64:base-4.0-noarch:core-4.0-amd64:core-4.0-
noarch:graphics-4.0-amd64:graphics-4.0-noarch:printing-4.0-amd64:printing-4.0-
noarch
CentOS release 6.4 (Final)
CentOS release 6.4 (Final)
Jameson Nash
Oct 24, 2013, 12:28:27 PM10/24/13
to julia...@googlegroups.com
What version of Gtk? The Cairo buffer wasnt exposed initially.
No. The Cairo buffer is created in Julia: just change the type from the platform-accelerated buffer to an RGB buffer of the same size. I could add a fallback for Gtk which does this for your error case, if there is interest -- please open a bug report so I can track it.
Tim Holy
Oct 24, 2013, 12:58:45 PM10/24/13
to julia...@googlegroups.com
On Thursday, October 24, 2013 12:28:27 PM Jameson Nash wrote:
> What version of Gtk? The Cairo buffer wasnt exposed initially.
$ locate libgtk
> What version of Gtk? The Cairo buffer wasnt exposed initially.
/usr/lib/libgtk-x11-2.0.so.0
/usr/lib/libgtk-x11-2.0.so.0.1800.9
/usr/lib64/libgtk-vnc-1.0.so.0
/usr/lib64/libgtk-vnc-1.0.so.0.0.1
/usr/lib64/libgtk-x11-2.0.so
/usr/lib64/libgtk-x11-2.0.so.0
/usr/lib64/libgtk-x11-2.0.so.0.1800.9
/usr/lib64/libgtkmm-2.4.so.1
/usr/lib64/libgtkmm-2.4.so.1.1.0
/usr/lib64/libgtksourceview-2.0.so.0
/usr/lib64/libgtksourceview-2.0.so.0.0.0
/usr/lib64/libgtkspell.so.0
/usr/lib64/libgtkspell.so.0.0.0
/usr/lib64/gcj-4.4.4/libgtkpeer.so
> No. The Cairo buffer is created in Julia: just change the type from the
> platform-accelerated buffer to an RGB buffer of the same size. I could add
> a fallback for Gtk which does this for your error case, if there is
> interest -- please open a bug report so I can track it.
using Winston
x = 1:10^5
p = plot(x,rand(length(x)))
x = 1:10^5
surf = Cairo.CairoRGBSurface(500,500)
@time Winston.page_compose(p, surf)
elapsed time: 37.507734999 seconds (32033364 bytes allocated)
By comparison, plot takes 2.7 secs.
On that CentOS system, I get different results:
julia> @time p = plot(x,rand(length(x)))
elapsed time: 2.734462098 seconds (10076424 bytes allocated)
FramedPlot(...)
julia> @time Winston.page_compose(p, surf)
elapsed time: 2.220651824 seconds (9006060 bytes allocated)
So a lot better, but still ridiculously slow. (On that CentOS machine, I can't
easily install chrome for comparison because it requires a newer libstdc++
than CentOS 6.4 provides.)
--Tim
Patrick O'Leary
Oct 24, 2013, 1:01:28 PM10/24/13
to julia...@googlegroups.com, Patrick O'Leary
I believe it does. You can try to override that and use Skia (which I believe is what Chrome/ium uses) by setting the pref gfx.canvas.azure.backends to "skia,cairo" in about:config. Apparently there are some rendering issues though on Linux that they never worked out.
Would be curious how this works on Windows with the Direct2D backend; I may try that tonight.
Tim Holy
Oct 24, 2013, 1:15:36 PM10/24/13
to julia...@googlegroups.com
On Thursday, October 24, 2013 10:01:28 AM Patrick O'Leary wrote:
> I believe it does. You can try to override that and use Skia (which I
> believe is what Chrome/ium uses) by setting the pref
> gfx.canvas.azure.backends to "skia,cairo" in about:config. Apparently there
> are some rendering issues though on Linux that they never worked out.
>
> Would be curious how this works on Windows with the Direct2D backend; I may
> try that tonight.
Cool trick! Reduced firefox's rendering time on my laptop from > 100s to 0.4 s.
> I believe it does. You can try to override that and use Skia (which I
> believe is what Chrome/ium uses) by setting the pref
> gfx.canvas.azure.backends to "skia,cairo" in about:config. Apparently there
> are some rendering issues though on Linux that they never worked out.
>
> Would be curious how this works on Windows with the Direct2D backend; I may
> try that tonight.
--Tim
Tim Holy
Oct 24, 2013, 4:14:57 PM10/24/13
to julia...@googlegroups.com
On Thursday, October 24, 2013 10:01:28 AM Patrick O'Leary wrote:
> Would be curious how this works on Windows with the Direct2D backend; I may
> try that tonight.
I just tested my lab's Windows machine with a Julia installation (64bit). It's
> Would be curious how this works on Windows with the Direct2D backend; I may
> try that tonight.
a fairly beefy workstation: 8-core 3.6 GHz with high-end motherboard and RAM
(1600 MHz), NVidia GeForce GTX 650 Ti.
Results: Winston, Cairo/Tk backend, 137 seconds. Packages were installed from
Pkg.add().
Chrome running the comparable HTML5 <canvas> script: 0.02 seconds! (If it can
be believed; certainly, it was so fast that I couldn't even guess at its run
time.)
It seems that the question of whether HTML5's canvas is fast enough for our
purposes has been largely answered. (It would be good to test fills, images,
etc, of course.)
--Tim
John Lynch
Oct 24, 2013, 4:43:40 PM10/24/13
to julia...@googlegroups.com
Tim,
Apologies for the dumb question that follows.
I'm using PyPlot and Gadfly primarily from IPython (on Chrome). I'm not surprised that chrome and html5 are fast, given their effort in speed of startup and operation. Do any of our current graphics options call that engine?
Apologies for the dumb question that follows.
I'm using PyPlot and Gadfly primarily from IPython (on Chrome). I'm not surprised that chrome and html5 are fast, given their effort in speed of startup and operation. Do any of our current graphics options call that engine?
Patrick O'Leary
Oct 24, 2013, 4:45:56 PM10/24/13
to julia...@googlegroups.com
Direct2D is the Firefox default on Windows, so it should be straightforward to try that out. Of course that still leaves Linux Firefox users out in the cold, even if that works.
Blake Johnson
Oct 24, 2013, 9:16:51 PM10/24/13
to julia...@googlegroups.com
On Thursday, October 24, 2013 6:11:45 AM UTC-4, Tim Holy wrote:
On Wednesday, October 23, 2013 06:31:31 AM Blake Johnson wrote:
> It would be interesting to see how ContinuumIO's Bokeh would do on your
> test. Has anyone here played with it yet?
I've not. But fundamentally this seems to be about the graphics library
performance rather than the plotting infrastructure. In none of these cases
does the Julia code take any appreciable time, it's all spent waiting for the
renderer to do its job, and too many of the renderers are frustratingly slow
(at least, on my machine). That's why I think we need to choose the graphics
back end very carefully.
Fair enough. I just remember Peter Wang suggested a different strategy to deal with this problem: have the back-end produce some kind of reduction of high-density data into a more easily renderable representation. I don't quite know how this would work in practice. For instance, you might want to convert a scatter plot into a density plot if you have enough points, but then how do you still reveal outliers? A mixed density-scatter plot? What does that look like?
In any case, it looks like Bokeh 0.2 was released yesterday: http://bokeh.pydata.org/, but it doesn't look like they've really tackled this problem, yet.
Chris Foster
Oct 25, 2013, 6:22:54 AM10/25/13
to julia...@googlegroups.com
On Fri, Oct 25, 2013 at 12:14 AM, Patrick O'Leary
<patrick...@gmail.com> wrote:
> Check AzureCanvasBackend in about:support to see which renderer Firefox is
> using for canvases.
Thanks, this confirms that firefox is indeed using cairo.
<patrick...@gmail.com> wrote:
> Check AzureCanvasBackend in about:support to see which renderer Firefox is
> using for canvases.
I tried setting gfx.canvas.azure.backends to "skia,cairo" as suggested
by Patrick and restarting, which resulted in an amazing speed boost:
only 0.26 s for the full 10^5 points, and 0.98 s for 10^6 points.
Clearly there is something very wrong with cairo on my system!
Tim Holy
Oct 25, 2013, 6:40:14 AM10/25/13
to julia...@googlegroups.com
On Thursday, October 24, 2013 06:16:51 PM Blake Johnson wrote:
> Fair enough. I just remember Peter Wang suggested a different strategy to
> deal with this problem: have the back-end produce some kind of reduction of
> high-density data into a more easily renderable representation.
I think we should do the same thing, when possible. In some cases it's pretty
> Fair enough. I just remember Peter Wang suggested a different strategy to
> deal with this problem: have the back-end produce some kind of reduction of
> high-density data into a more easily renderable representation.
straightforward (e.g., https://groups.google.com/d/msg/julia-
dev/Mi44lkCusCw/MpJqAMJ2ikQJ), in others indeed it's not obvious how to
proceed.
But first we should juice as much out of the graphics library as possible
without getting fancy.
> In any case, it looks like Bokeh 0.2 was released
> yesterday: http://bokeh.pydata.org/, but it doesn't look like they've
> really tackled this problem, yet.
--Tim
Tim Holy
Oct 25, 2013, 9:30:42 AM10/25/13
to julia...@googlegroups.com
While there are still some performance issues to address, Jeff has come up with
a simple workaround for this particular Cairo issue:
https://github.com/nolta/Winston.jl/issues/89
Doesn't help firefox, of course, but it does help us!
--Tim
a simple workaround for this particular Cairo issue:
https://github.com/nolta/Winston.jl/issues/89
Doesn't help firefox, of course, but it does help us!
--Tim
Tim Holy
Oct 25, 2013, 9:34:21 AM10/25/13
to julia...@googlegroups.com
On Thursday, October 24, 2013 01:43:40 PM John Lynch wrote:
> I'm using PyPlot and Gadfly primarily from IPython (on Chrome). I'm not
> surprised that chrome and html5 are fast, given their effort in speed of
> startup and operation. Do any of our current graphics options call that
> engine?
Not as far as I know.
> I'm using PyPlot and Gadfly primarily from IPython (on Chrome). I'm not
> surprised that chrome and html5 are fast, given their effort in speed of
> startup and operation. Do any of our current graphics options call that
> engine?
--Tim
Message has been deleted

sig...@kcl.ac.uk
Oct 25, 2013, 12:48:22 PM10/25/13
to julia...@googlegroups.com
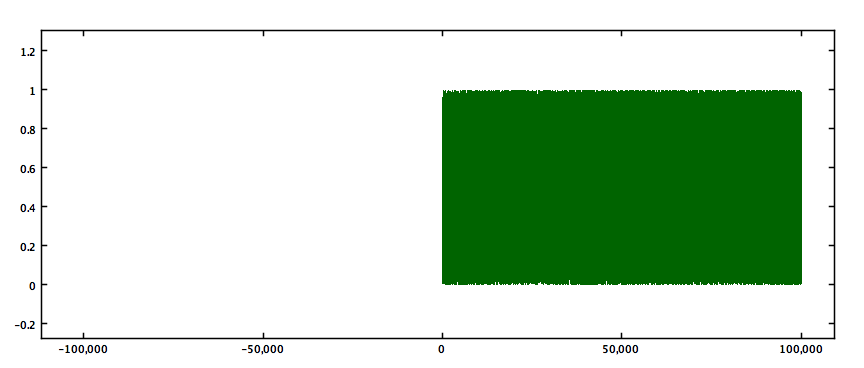
On Friday, October 25, 2013 5:29:48 PM UTC+1, sig...@kcl.ac.uk wrote:
At the risk of becoming a bore illustrating my own code, here's the test done with Waterloo.This shows 10^5 random points drawn as a line and streamed in "real time" to an animated GIF simultaneously while I used the mouse to alter the axes. Java may be too slow for processing data - but its graphics may not be as slow as some suppose.

ron.s...@gmail.com
Oct 25, 2013, 3:17:44 PM10/25/13
to julia...@googlegroups.com
Sadly, running Tim's timing code gives me this on a Mac for 10^5 points:
julia> @time plot(x,rand(length(x)))
elapsed time: 829.954211274 seconds (10053264 bytes allocated)
FramedPlot(...)
Has anyone thought of a native Quartz backend for Macs?
Tim Holy
Oct 25, 2013, 5:02:49 PM10/25/13
to julia...@googlegroups.com
On Friday, October 25, 2013 12:17:44 PM ron.s...@gmail.com wrote:
> Sadly, running Tim's timing code gives me this on a Mac for 10^5 points:
>
> julia> @time plot(x,rand(length(x)))
> elapsed time: 829.954211274 seconds (10053264 bytes allocated)
> FramedPlot(...)
If you're not already, you need to be on master of Winston.
> Sadly, running Tim's timing code gives me this on a Mac for 10^5 points:
>
> julia> @time plot(x,rand(length(x)))
> elapsed time: 829.954211274 seconds (10053264 bytes allocated)
> FramedPlot(...)
--Tim

muraveill
Oct 26, 2013, 2:39:38 PM10/26/13
to julia...@googlegroups.com
I found appropriate to post here the only negative feedback I got after a presentation I gave on Julia: "but the graph is ugly - and the syntax to get it, too".
Before I develop, I want to emphasize that it is a very important concern for our potential users (biologists and bioinformaticians).
Here are the main reasons - how I got to this graph as a newbie user:
- I had no idea of which library I should use (in particular, I expected a section "Julia graphics" in the Manual).
- The doc for Gadfly (@GitHub) was poor; the average user has no idea of the "grammar of graphics" and does not use RDatasets; the user wants plot(x,y,...) to be the standard and not an "heretic version"; the user wants X11 and not SVG.
- Because of the latter I tried Winston. I got a graph quickly with a code that they found ugly, too, because of the column of "setattr" statements.
- I could never manage to have a picture appear when I just type plot(x,y,...) as it would in R (X11). So I opted for a PGN, but this is a big issue: one wants to keep the result in a file only 1/100 of the time, I would say (including tests until it looks like what you want).
- Winston produced black squares as for points; the title is not centered in the frame; the default figure's margins are counter-intuitive (square frame instead of wrapping the plot's dimensions).
- Having to try a third library when the two first fail is extremely tedious and even I gave up as the presenter, so imagine the average R user.
Most R users here (and I see a lot at work) do not even know about ggplot2 and all they want is a unique plot() function that does everything simply and quickly, like in R, without needing to import a particular package. There must be a standard graphics library included by default with the Julia distribution
Actually since biologists know nearly nothing about stats, R is used only for graphics, so if you want to succeed in converting R users, work a lot in this direction.
Before I develop, I want to emphasize that it is a very important concern for our potential users (biologists and bioinformaticians).
Here are the main reasons - how I got to this graph as a newbie user:
- I had no idea of which library I should use (in particular, I expected a section "Julia graphics" in the Manual).
- The doc for Gadfly (@GitHub) was poor; the average user has no idea of the "grammar of graphics" and does not use RDatasets; the user wants plot(x,y,...) to be the standard and not an "heretic version"; the user wants X11 and not SVG.
- Because of the latter I tried Winston. I got a graph quickly with a code that they found ugly, too, because of the column of "setattr" statements.
- I could never manage to have a picture appear when I just type plot(x,y,...) as it would in R (X11). So I opted for a PGN, but this is a big issue: one wants to keep the result in a file only 1/100 of the time, I would say (including tests until it looks like what you want).
- Winston produced black squares as for points; the title is not centered in the frame; the default figure's margins are counter-intuitive (square frame instead of wrapping the plot's dimensions).
- Having to try a third library when the two first fail is extremely tedious and even I gave up as the presenter, so imagine the average R user.
p = FramedPlot()
add(p, Points( log10(means), log2(ratios), "type", "dot" ))
setattr(p, "title", "MA-plot")
setattr(p, "xlabel", "\\Means")
setattr(p, "ylabel", "\\Ratios")
setattr(p, "aspect_ratio", 0.75 )
setattr(p.x1, "range", (-1,6) )
setattr(p.y1, "range", (-6,6) )
file(p, "maplot.png")
- See more at: http://bioinfo-fr.net/julia-le-successeur-de-r#sthash.Ib3FC05n.dpufActually since biologists know nearly nothing about stats, R is used only for graphics, so if you want to succeed in converting R users, work a lot in this direction.
p = FramedPlot()
add(p, Points( log10(means), log2(ratios), "type", "dot" ))
setattr(p, "title", "MA-plot")
setattr(p, "xlabel", "\\Means")
setattr(p, "ylabel", "\\Ratios")
setattr(p, "aspect_ratio", 0.75 )
setattr(p.x1, "range", (-1,6) )
setattr(p.y1, "range", (-6,6) )
file(p, "maplot.png")
- See more at: http://bioinfo-fr.net/julia-le-successeur-de-r#sthash.Ib3FC05n.dpufp = FramedPlot()
add(p, Points( log10(means), log2(ratios), "type", "dot" ))
setattr(p, "title", "MA-plot")
setattr(p, "xlabel", "\\Means")
setattr(p, "ylabel", "\\Ratios")
setattr(p, "aspect_ratio", 0.75 )
setattr(p.x1, "range", (-1,6) )
setattr(p.y1, "range", (-6,6) )
file(p, "maplot.png")
- See more at: http://bioinfo-fr.net/julia-le-successeur-de-r#sthash.Ib3FC05n.dpufMessage has been deleted
Message has been deleted
John Lynch
Oct 26, 2013, 6:36:21 PM10/26/13
to julia...@googlegroups.com
Muraveill,
I have found (in the last week) that Gadfly is very easy to use and produces attractive outputs like ggplot. My previous experience is excel, stata, python matplotlib, and the three R packages but not a lot of any except excel.
Gadfly is easier than most. I've created a Reference Sheet from Daniels Manual to the commands on one page. I think that if there was a 1 pager that took the new user from install/using to producing a couple of example plots you might have a good fit for your audience. So 1 page summary, 1 page example for the heretical X vs Y condition by Z and 1 page doing it with dataframes.
I did the Harvard Biostats and Epidemiology MOOC so I'll drag some examples from that data but perhaps you could come up with a couple of data sets that would be typical of your audience and I could use them?
Also Daniel is willing to add features to match the audiences needs.
What do you think?
ron.s...@gmail.com
Oct 27, 2013, 5:56:50 PM10/27/13
to julia...@googlegroups.com
Switching to the master branch of Winston brought the plot timing down to 0.24 s, for a 3300x speedup. I'll settle for that ;-)
Joonas Nättilä
Oct 28, 2013, 6:08:07 AM10/28/13
to julia...@googlegroups.com
The syntax of Winston is being fixed, and hopefully soon you can just use the plot function like this
plot(log10(means),log2(ratios),symboltype="dot",title="MA-plot",xlabel="Means",ylabel="Ratios",aspect_ratio=0.75,xrange=[-1,6],yrange=[-6,6])
file("maplot.png")

yaois...@gmail.com
Nov 5, 2014, 3:43:14 PM11/5/14
to julia...@googlegroups.com
Hi all -- perhaps I am erring by necro-ing a thread from last year. However, this was the closest thing I found to a survey of all the plotting options available on Julia and I thought it wouldn't be so bad to revive this thread for an updated discussion.
How is the field of plotting options now? Has the community started to gravitate to some over others? At this point, it looks like Winston and Gadfly are still the primary options native to Julia (and stylistically quite different), while PyPlot.jl pretty awesomely imports Matplotlib.
How is the field of plotting options now? Has the community started to gravitate to some over others? At this point, it looks like Winston and Gadfly are still the primary options native to Julia (and stylistically quite different), while PyPlot.jl pretty awesomely imports Matplotlib.

Daniel Carrera
Nov 6, 2014, 9:16:48 AM11/6/14
to julia...@googlegroups.com
On Wednesday, 5 November 2014 21:43:14 UTC+1, yaois...@gmail.com wrote:
Hi all -- perhaps I am erring by necro-ing a thread from last year. However, this was the closest thing I found to a survey of all the plotting options available on Julia and I thought it wouldn't be so bad to revive this thread for an updated discussion.
How is the field of plotting options now? Has the community started to gravitate to some over others? At this point, it looks like Winston and Gadfly are still the primary options native to Julia (and stylistically quite different), while PyPlot.jl pretty awesomely imports Matplotlib.
There is no "winner" at this point. I suspect that opinions differ strongly. I once saw someone suggest that we should prefer Winton and Gadfly because they are native Julia. I couldn't disagree more. For me PyPlot is the only viable option because I need plots for scientific publications (in astronomy) and I need a mature package where I can feel confident that I can make any tweaks that my supervisor asks for. The moment I say that I cannot do X, he will say that I should have been using IDL instead of Julia. Winston simply does not have the maturity, range of features and documentation of Matplotlib. My impression is that Gadfly is more mature than Winston (maybe I am wrong) and the API is interesting, but it is not my preferred API. Gadfly should appeal to people coming from R. I am not coming from R.
Just my two cents.
Cheers,
Daniel.
Daniel Carrera
Nov 6, 2014, 9:23:55 AM11/6/14
to julia...@googlegroups.com
One side-comment: I recently submitted a paper, and in it, some of the plots are still done in IDL rather than Julia because I could not manage to make the heat maps look sufficiently nice in Matplotlib. Making good colour schemes for heat maps can be really tricky.
Cheers,
Daniel.
-- When an engineer says that something can't be done, it's a code phrase that means it's not fun to do.

Tamas Papp
Nov 6, 2014, 9:33:27 AM11/6/14
to julia...@googlegroups.com
models, and each user could prefer one to the other without any
consensus emerging. On R, I use the built-in plotting commands for
simple tasks, ggplot2 for data analysis, and lattice when I need
something in between, and it is not clear to me that any of them is a
"winner" in the sense that it always dominates the others, even though R
has been around much longer than Julia.
In particular, the Grammar of Graphics model used by Gadly is powerful,
but it takes a lot of investment to learn to use it effectively, and
also, it may not be the best option for non-standard plots. So I hope
all existing approaches will continue to thrive.
Best,
Tamas
Reply all
Reply to author
Forward
0 new messages