intersection between a curve and a line
351 views
Skip to first unread message

davideber...@gmail.com
Mar 29, 2019, 12:20:36 PM3/29/19
to JSXGraph
I have a curve (y=e^x) and a line (y=2). Is it possible to have the intersection point of these and to see it displayed in a graph as a point.
Thank you very much.
Davide.

Hovo Menejyan
Mar 29, 2019, 12:50:34 PM3/29/19
to JSXGraph
Yes, it is possible.
You can use the following method to find the intersection and then just place a point at that location.
You can even find all the intersections by using this method(think about curves such as sin(x) and the x axis, there are more than 1 intersection). Here is some pseudoCode that finds all the intersections.
You can use the following method to find the intersection and then just place a point at that location.
JXG.Math.Geometry.meetCurveLine(el1, el2, nr, board, alwaysIntersect)You can even find all the intersections by using this method(think about curves such as sin(x) and the x axis, there are more than 1 intersection). Here is some pseudoCode that finds all the intersections.
let finishedFindingIntersections = false;
let i = 0;
let intersectionCoords = [];
while(!finishedFindingIntersections) {
  let newPoint;
  newPoint = window.JXG.Math.Geometry.meetCurveLine(yourCurve, yourLine, i, this.board, true).usrCoords;


  if (isNaN(newPoint[1])) {
    finishedFindingIntersections = true;
  } else {
    intersectionCoords.push([newPoint[1], newPoint[2]]);
    i += 1;
  }
}
After this you can just put points by using the data that you have in intersectionCoords array.
Take a look at the following webpage for all the possible intersection types and for the descriptions.
https://jsxgraph.uni-bayreuth.de/docs/symbols/JXG.Math.Geometry.html
Take a look at the following webpage for all the possible intersection types and for the descriptions.
https://jsxgraph.uni-bayreuth.de/docs/symbols/JXG.Math.Geometry.html
davideber...@gmail.com
Apr 1, 2019, 6:10:55 AM4/1/19
to JSXGraph
Now I have a line that is mobile through a slider.
The intersection point remain fixed at the first value.
How to render the intersection point dinamic?
Here is the code.
<code>
<div class="grafico">
<div id="box3" class="jxgbox" style="height: 240px; width: 260px;"></div>
<div id="box4c" class="jxgbox" style="height: 90px; width: 250px;"></div>
<script type="text/javascript">
JXG.Options.point.label = {highlight: false, offset:[-10,10]};
JXG.Options.line.label = {highlight: false, offset:[-10,10]};
JXG.Options.text.useMathJax = true;
JXG.Options.axis.ticks.minorTicks = 0;
JXG.Options.axis.ticks.majorHeight = -1;
JXG.Options.axis.ticks.label = {visible: false, highlight: false, offset:[-12,-10]};
board4c = JXG.JSXGraph.initBoard('box4c', {boundingbox: [0, 1.33, 10, -1.33], showNavigation: false, showCopyright: false, grid: false, pan: false, zoom: false});
sliderBLU3_2 = board4c.create('slider',[[0.8,0.5],[8.5,0.5],[0.1, 1.67, 2]], {id:'slider3_0', highlight:false,highline: {highlight:false}, baseline: {highlight:false}, fillColor:'blue',strokeColor:'black', withLabel:true});
board4c.create('text',[0, 0.5, function(){return '' + 'a' + ''}],{fontSize:'', fixed:true, highlight:false});
board3 = JXG.JSXGraph.initBoard('box3', {originX: 60, originY: 140, unitX: 50, unitY: 50, showNavigation: false, showCopyright: false, axis: true, zoomX: 0.4, zoomY: 0.4, fixed: true, pan: false, zoom: false});
board4c.addChild(board3);
board3.create('text',[9, -0.35, function(){return "x"}], {highlight: false, fixed:true});
board3.create('text',[-0.5, 6.5, function(){return "y"}], {highlight: false, fixed:true});
label_zero3 = board3.create('text',[-0.5, -0.35, function(){return "O"}], {fixed: true, highlight: false});
var graph = board3.create('functiongraph',
[function(x){ return Math.pow(1.2, x);}, -4, 10]
);
var p_for_line1 = board3.create('point', [0, function(x){ return sliderBLU3_2.Value();}], {name:'1', strokeColor:'white', fillColor:'red', highlight: false, fixed:true, visible: false, label:{highlight: false, offset:[5,-10]} });
var p_for_line2 = board3.create('point', [1, function(x){ return sliderBLU3_2.Value();}], {name:'1', strokeColor:'white', fillColor:'red', highlight: false, fixed:true, visible: false, label:{highlight: false, offset:[5,-10]} });
var line1 = board3.create('line', [p_for_line1, p_for_line2], {strokeColor:'red', highlight: false, fixed:true });
let newPoint;
newPoint = window.JXG.Math.Geometry.meetCurveLine(graph, line1, 0, this.board, true).usrCoords;
var p1 = board3.create('point', [0, 1], {name:'1', strokeColor:'white', fillColor:'red', highlight: false, fixed:true, label:{highlight: false, offset:[5,-10]} });
var intersection_point = board3.create('point', [newPoint[1], newPoint[2]], { strokeColor:'white', fillColor:'red', highlight: false, fixed:true, label:{highlight: false, offset:[5,-10]} });
</script>
</div>
</code>

Alfred Wassermann
Apr 3, 2019, 8:14:13 AM4/3/19
to JSXGraph
The intersection element supports intersection points of curves and lines.
Here is an examples, see https://jsfiddle.net/L9knors5/ :
var li = board.create('line', [[-4,2], [4,2]], {point1:{visible:true, color:'red', layer:9}, point2:{visible:true, color:'red', fixed: false,layer:9}});
var cu = board.create('functiongraph', ['exp(x)']);
var po = board.create('intersection', [li, cu]);
Best wishes,
Alfred

0llowain !
Apr 28, 2021, 2:15:36 PM4/28/21
to JSXGraph
Hey,
could you add this to the documentation?
Would have saved me some trouble.
It states here that only Lines and Circles are supported.
Greetings
Alfred Wassermann
May 12, 2021, 7:17:42 AM5/12/21
to JSXGraph
Good suggestion!
The updated API reference is now in the 1.2.3 branch and will be released soon.
Many thanks,
Alfred

Renju Soman
Apr 22, 2022, 3:45:11 AM4/22/22
to JSXGraph
Is it possible to find the other intersection of a curve and line? I used the below code it's not working.
var f = board.create('curve', [function(t){ return Math.sqrt(2)*3*Math.cos(t);},
function(t){ return Math.sqrt(3)*3*Math.sin(t);}],{highlight:false,strokeWidth:2});
var l3 = board.create('line', [[1,1] ,[1,3]],{highlight:false, strokeColor:'green'});
var i = board.create('intersection', [f, l3],{name:'',color:'black',size:2});
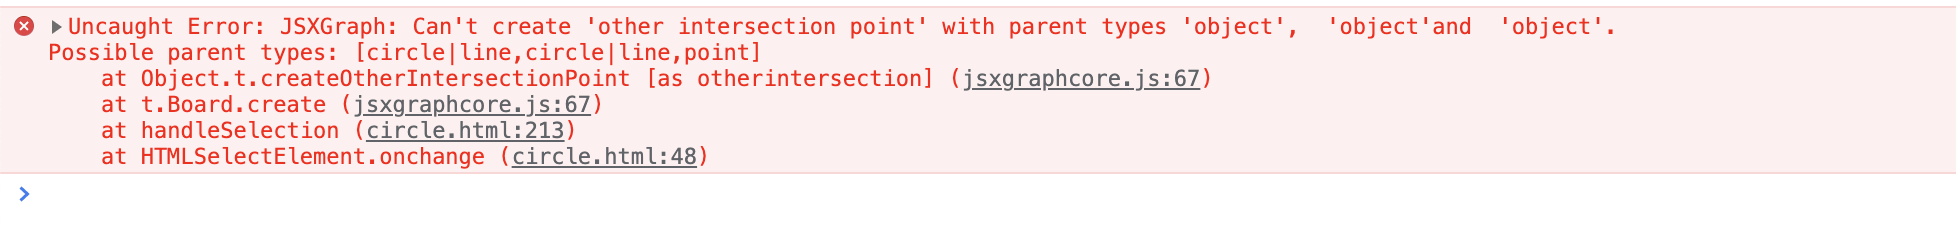
var j = board.create('otherintersection', [f, l3, i]);
function(t){ return Math.sqrt(3)*3*Math.sin(t);}],{highlight:false,strokeWidth:2});
var l3 = board.create('line', [[1,1] ,[1,3]],{highlight:false, strokeColor:'green'});
var i = board.create('intersection', [f, l3],{name:'',color:'black',size:2});
var j = board.create('otherintersection', [f, l3, i]);
Its showing the below error.

古今中外数学网
May 17, 2022, 8:26:31 AM5/17/22
to JSXGraph
I have same issue, how to get other intersection point when a line meet a curve.
not sure how to solve this issue.
Alfred Wassermann
May 25, 2022, 2:33:57 AM5/25/22
to JSXGraph
Sorry for the long delay of my answer!
The right way to create "other" intersection points is to give the number, see it live at https://jsfiddle.net/0a1s39yu/1/ :
const board = JXG.JSXGraph.initBoard('jxgbox', {
boundingbox: [-6, 6, 6, -6], axis:true
});
boundingbox: [-6, 6, 6, -6], axis:true
});
var f = board.create('curve', [
(t) => Math.sqrt(2)*3*Math.cos(t),
(t) => Math.sqrt(3)*3*Math.sin(t)
],{
highlight:false,
(t) => Math.sqrt(3)*3*Math.sin(t)
],{
highlight:false,
strokeWidth:2
});
var l3 = board.create('line', [[1,1] ,[1,3]],{highlight:false, strokeColor:'green'});
var i = board.create('intersection', [f, l3, 0],{name:'',color:'black',size:2});
var j = board.create('intersection', [f, l3, 1]);
var j = board.create('intersection', [f, l3, 1]);
The element "otherintersection" works only for line / circle, circle / circle intersections. There, it is clear
that there are at most two intersection points. However, there mighty be many more intersection points between a line and a curve.
Best wishes,
Alfred
Reply all
Reply to author
Forward
0 new messages