Dynamic domain of definition
15 views
Skip to first unread message

Matt
May 19, 2021, 5:56:57 AM5/19/21
to JSXGraph
Since I got such a quick and helpful answer on my last question, I'll just try it again.
My code displays a sinusoid in polar coordinate form. Now I want to block out the display of those parts of the curve where the y-Value of the sinus is negative.
The function itself is adjustable via sliders and therefore the zeros can change depending on the user's input. Therefore it is required that the domain of definition of the polar coordinate form changes with the user input.
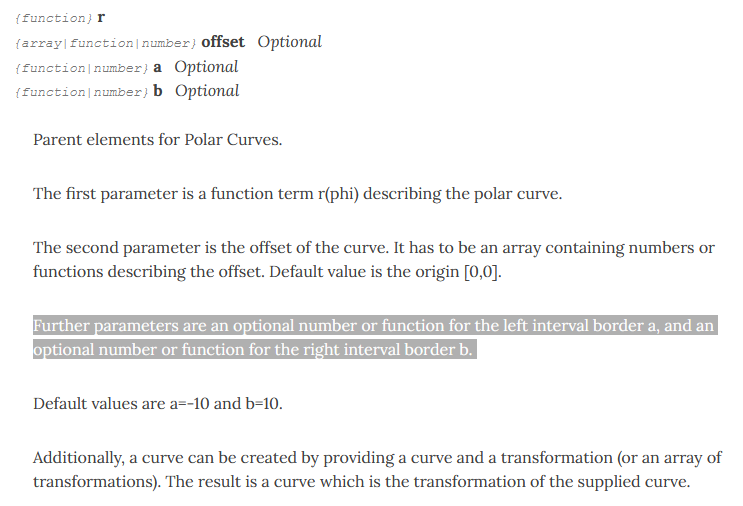
In the JSXgraph reference it is mentioned that the interval borders are adjustable but my issue is that I will have several holes in my domain of definition, so just a left and right interval border are not enough.
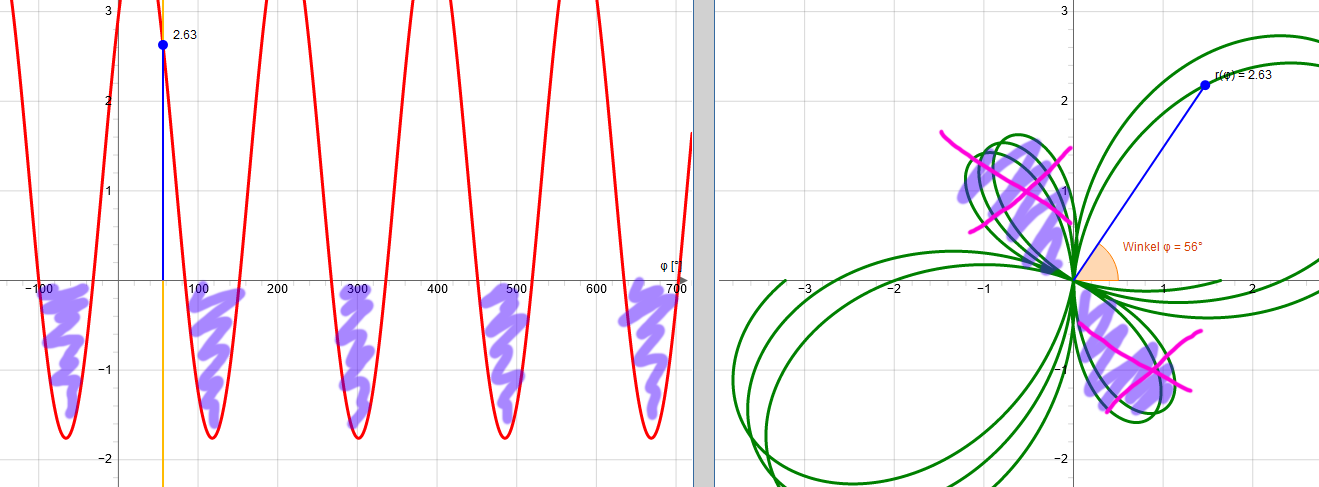
The second image shows my current page. In this case I want the five little green curve parts on the right display gone. The purple markers are just to show how the two curves are related.
I am creating both functions from slider values.
Would the easiest way be to just draw a seperate green function for each positive sinus interval?
Ignore tabs 2 and 3, I have not updated them yet and they are from a different project. Also please don't get a stroke from my horrible way of programming JS and for not styling things in the CSS file, this is my first HTML/JS/CSS project.

Alfred Wassermann
May 19, 2021, 6:19:18 AM5/19/21
to JSXGraph
Hi Matt,
without looking at the details of our code, you can exclude certain parts of a curve from being plotted by returning NaNs:
Here is an example for the function graph part of your example, see it at https://jsfiddle.net/cezby175/
var sl = board.create('slider', [[1,3], [3,3],[-2, 1, 10]]);
var curve = board.create('functiongraph', [function(x) {
var y = Math.sin(sl.Value() * x);
return (y >= 0.0) ? y : NaN;
}]);
Best wishes,
var curve = board.create('functiongraph', [function(x) {
var y = Math.sin(sl.Value() * x);
return (y >= 0.0) ? y : NaN;
}]);
Best wishes,
Alfred
Matt
May 19, 2021, 7:14:55 AM5/19/21
to JSXGraph
Hey Alfred,
thank you so much! This works perfectly for me!
Best regards
Matt
Reply all
Reply to author
Forward
0 new messages