Reverse y axis issue
76 views
Skip to first unread message

mzyc...@gmail.com
Jun 22, 2018, 9:01:21 AM6/22/18
to jqplot-users
Hi


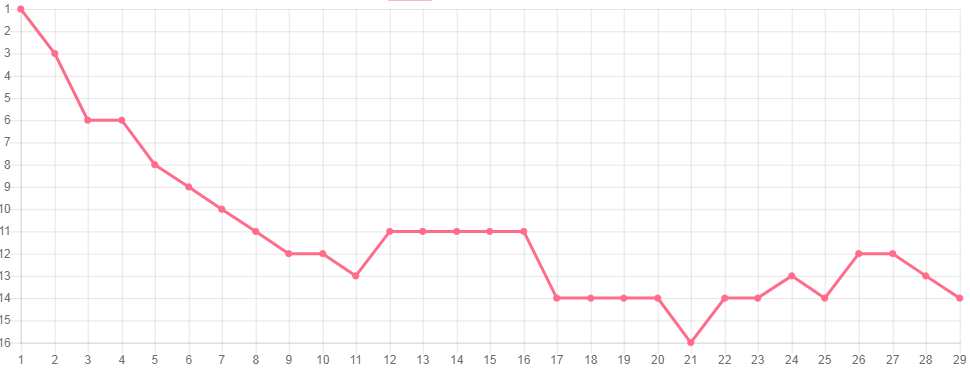
I have to create chart where y axix is in reverse order.
Max value should be 0 min 10.
It will show user position in ranking during some time/steps.
So the lower value (close 1) is better than higher.
But it seems that if I set reverse values on axis then chart does not look well.
I use the last version 1.0.9 (jquery.jqplot.1.0.9.d96a669.zip)
Could you help?
Detailed description:
If there is
yaxis: {
min: 10,
max:0
}

something does not work well:
- no horizontal grid lines
- no labels on series
- no labels on y axis
- no labels on mouse move
If there is
yaxis: {
min:0,
max:10
}
All is OK

$(document).ready(function(){
$.jqplot.config.enablePlugins = true;
var flotOptions = {
seriesDefaults:{
showMarker:true,
pointLabels: { show:true },
},
axesDefaults:{
showTicks:true,
showTickMarks:true,
tickInterval: 1,
tickOptions: {
formatString: '%i'
}
},
axes:{
xaxis:{
min:0,
max:10
},
yaxis: {
min:0,
max:10
}
}
};
var plot1 = $.jqplot ( 'chartdiv', [[1,1,1,1,1]], flotOptions);
});
<!--[if lt IE 9]><script language="javascript" type="text/javascript" src="js/excanvas.js"></script><![endif]-->
<script language="javascript" type="text/javascript" src="js/jquery.min.js"></script>
<script language="javascript" type="text/javascript" src="js/jquery.jqplot.min.js"></script>
<script language="javascript" type="text/javascript" src="js/plugins/jqplot.barRenderer.js"></script>
<script language="javascript" type="text/javascript" src="js/plugins/jqplot.categoryAxisRenderer.js"></script>
<script language="javascript" type="text/javascript" src="js/plugins/jqplot.cursor.js"></script>
<script language="javascript" type="text/javascript" src="js/plugins/jqplot.highlighter.js"></script>
<script language="javascript" type="text/javascript" src="js/plugins/jqplot.dragable.js"></script>
<script language="javascript" type="text/javascript" src="js/plugins/jqplot.pointLabels.js"></script>
<link rel="stylesheet" type="text/css" href="js/jquery.jqplot.css" />
best regards
MZ

Frits van Leeuwen
Jun 24, 2018, 3:46:54 AM6/24/18
to jqplot...@googlegroups.com
Thanks for your message, But what about negative numbers? Like -10
--
You received this message because you are subscribed to the Google Groups "jqplot-users" group.
To unsubscribe from this group and stop receiving emails from it, send an email to jqplot-users+unsubscribe@googlegroups.com.
To post to this group, send email to jqplot...@googlegroups.com.
Visit this group at https://groups.google.com/group/jqplot-users.
For more options, visit https://groups.google.com/d/optout.
Mariusz Zycinski
Jun 24, 2018, 4:12:27 AM6/24/18
to jqplot...@googlegroups.com
Thank you for your answer.
But because time was important I have used different solution: https://www.chartjs.org/
They have parameter "reverse":
ticks: { reverse: true }And it works well. So, thank you.
Best regards
MZ
To unsubscribe from this group and stop receiving emails from it, send an email to jqplot-users...@googlegroups.com.
To post to this group, send email to jqplot...@googlegroups.com.
Visit this group at https://groups.google.com/group/jqplot-users.
For more options, visit https://groups.google.com/d/optout.
--
You received this message because you are subscribed to the Google Groups "jqplot-users" group.
To unsubscribe from this group and stop receiving emails from it, send an email to jqplot-users...@googlegroups.com.
Reply all
Reply to author
Forward
0 new messages