jmxtrans tool and StatsDOutputWriter - Slave node data is getting summed up while collection
15 views
Skip to first unread message

Pooja Shelar
Mar 5, 2019, 8:13:57 PM3/5/19
to jmxtrans
Hello All,
I am a newbie.
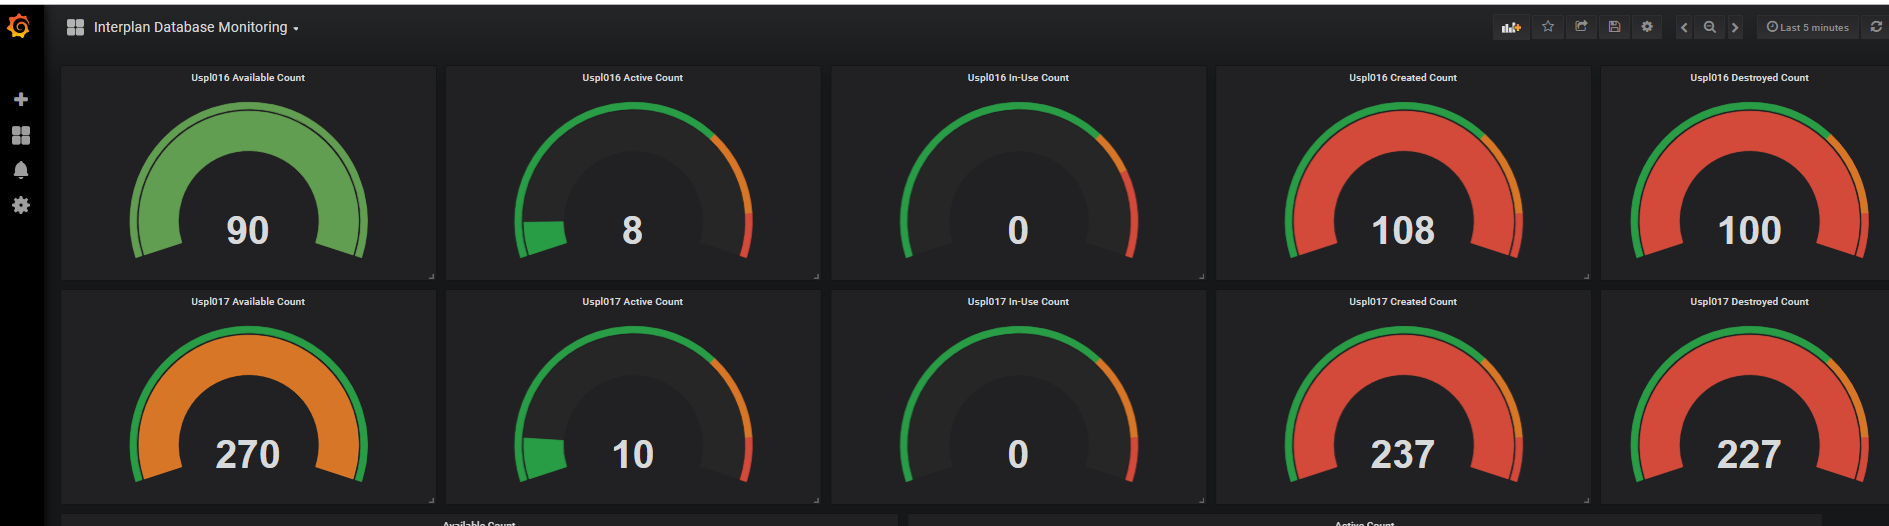
We are using "jmxtrans" tool to capture information like DB connections. We have a multi node application under monitoring and from the graphs in Grafana, it shows like the information for Slave node is getting summed up and shown on dashboard. Please take a look at the attached screen shot:
<outputWriter class="org.jmxtrans.agent.StatsDOutputWriter">
<host>abcdg123.spe.sony.com</host>
<port>8125</port>
<tags>jmx_</tags>
<!--namePrefix>InterplanDSJMX</namePrefix-->
<metricName>ussthr290.Dev.InterplanDSJMX</metricName>
</outputWriter>
<collectIntervalInSeconds>10</collectIntervalInSeconds>
- In attached screenshot, if you see the first row of “single stat” graphs, the Available count for Master node is showing value as 90 but the created count and destroyed count is showing values as 108 and 100, which is more than the available count. How can it be possible?
- Also, in the second row of “single stat” graphs, the available count for Slave host is showing value as 270, where as the configuration in domain.xml file is like below , where both the nodes should have Available count as 90
pool>
<min-pool-size>50</min-pool-size>
<max-pool-size>90</max-pool-size>
Request your help on the same.
Thanks!!!
Pooja Shelar
Mar 13, 2019, 2:49:53 PM3/13/19
to jmxtrans
Anyone please reply. It will be helpful for me.

nikhil govind
Mar 31, 2019, 1:04:09 PM3/31/19
to jmxtrans
The created count and the destroyed count is sum of all the data from the time of start and since the created connections get destroyed so again the pool is available for 90 connections.
Regarding the roll up data, can you check the time based log if the time at which the data comes and at which statsd sends the data does it match.
Like jmx trans sends data every 10 seconds, and statsd config reads data every 10 seconds but is it in sync ?
nikhil govind
Apr 1, 2019, 8:25:41 AM4/1/19
to jmxtrans
The slave node data is collected by the agent whoch in turn runs based on the xml and how the agent was loaded on the server and the naming conventions. Kindly check for all these three details and this should resolve your issue.
Happy Monitoring !!!!
Reply all
Reply to author
Forward
0 new messages