Active Threads Over Time Plugin Not Displaying All Thread Names
122 views
Skip to first unread message
Evan Wolf
Aug 8, 2022, 4:16:10 PM8/8/22
to jmeter-plugins
I have a single Thread Group with the name as:
"Thread Group Label With Unique ID: ${__time}"
In this thread group, I have set Number of Threads to 3.
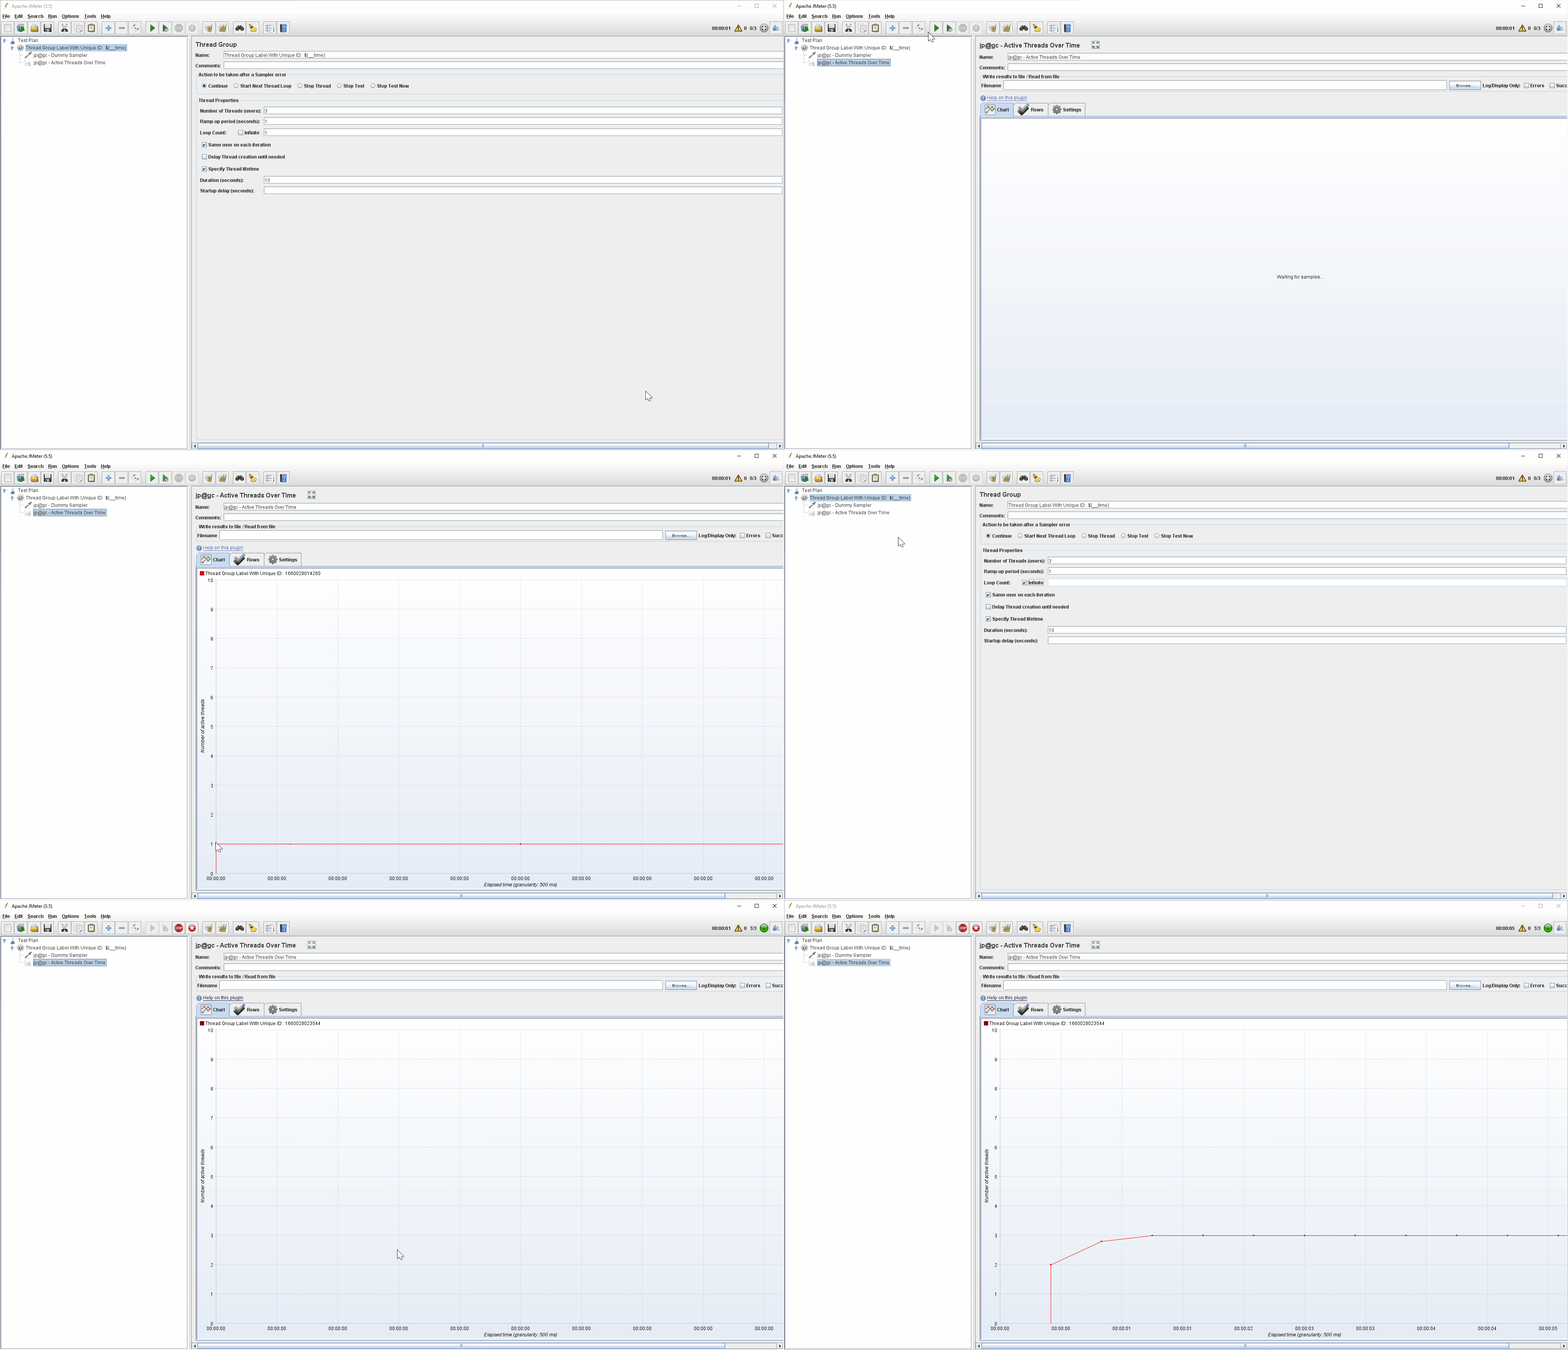
When I run the test, I only see 2 of the the 3 thread group labels in the plugin graph.
I am expecting every thread to appear in the graph.
"Thread Group Label With Unique ID: ${__time}"
In this thread group, I have set Number of Threads to 3.
When I run the test, I only see 2 of the the 3 thread group labels in the plugin graph.
I am expecting every thread to appear in the graph.
DT
Aug 9, 2022, 2:56:28 AM8/9/22
to jmeter-plugins
It doesn't matter what do you "expect", the plugin shows the number of active threads at the given time frame.
If your Thread Group configuration assumes that only 2 threads are active the chart will reflect it precisely.
Try decreasing the ramp-up period or increasing the number of loops so your test would last longer than 500 milliseconds (default Active Threads Over Time plugin granularity) as it might be the case 1st thread is shut down already by the time when 2nd and 3rd start.
You can also take a look at the .jtl results file, there is a column called grpThreads which shows the number of active threads in the current Thread Group at the current time, my "expectation" is that you don't have values more than 2 anywhere there.

Evan Wolf
Aug 9, 2022, 10:45:06 AM8/9/22
to jmeter-plugins
Please excuse my verbiage, I was writing this like a defect report. (Expected vs Actual Results)
My .jtl file was showing 3 active threads, which was correct.
My .jtl file was showing 3 active threads, which was correct.
I tried your advice, but no matter the ramp-up period, I would see that the thread group label would not be unique.
What fixed my issue was enabling 'Delay Thread Creation Until Needed' at the Thread Group level.
After enabling 'Delay Thread Creation Until Needed', I see all 3 threads drawn in the graph within the plugin, even with a 2s ramp up.
Thanks for your help
What fixed my issue was enabling 'Delay Thread Creation Until Needed' at the Thread Group level.
After enabling 'Delay Thread Creation Until Needed', I see all 3 threads drawn in the graph within the plugin, even with a 2s ramp up.
Thanks for your help
Reply all
Reply to author
Forward
0 new messages
