I am not able to find Transaction Per Second Plugin on Mac
50 views
Skip to first unread message


DT
Sep 6, 2021, 2:48:22 AM9/6/21
to jmeter-plugins
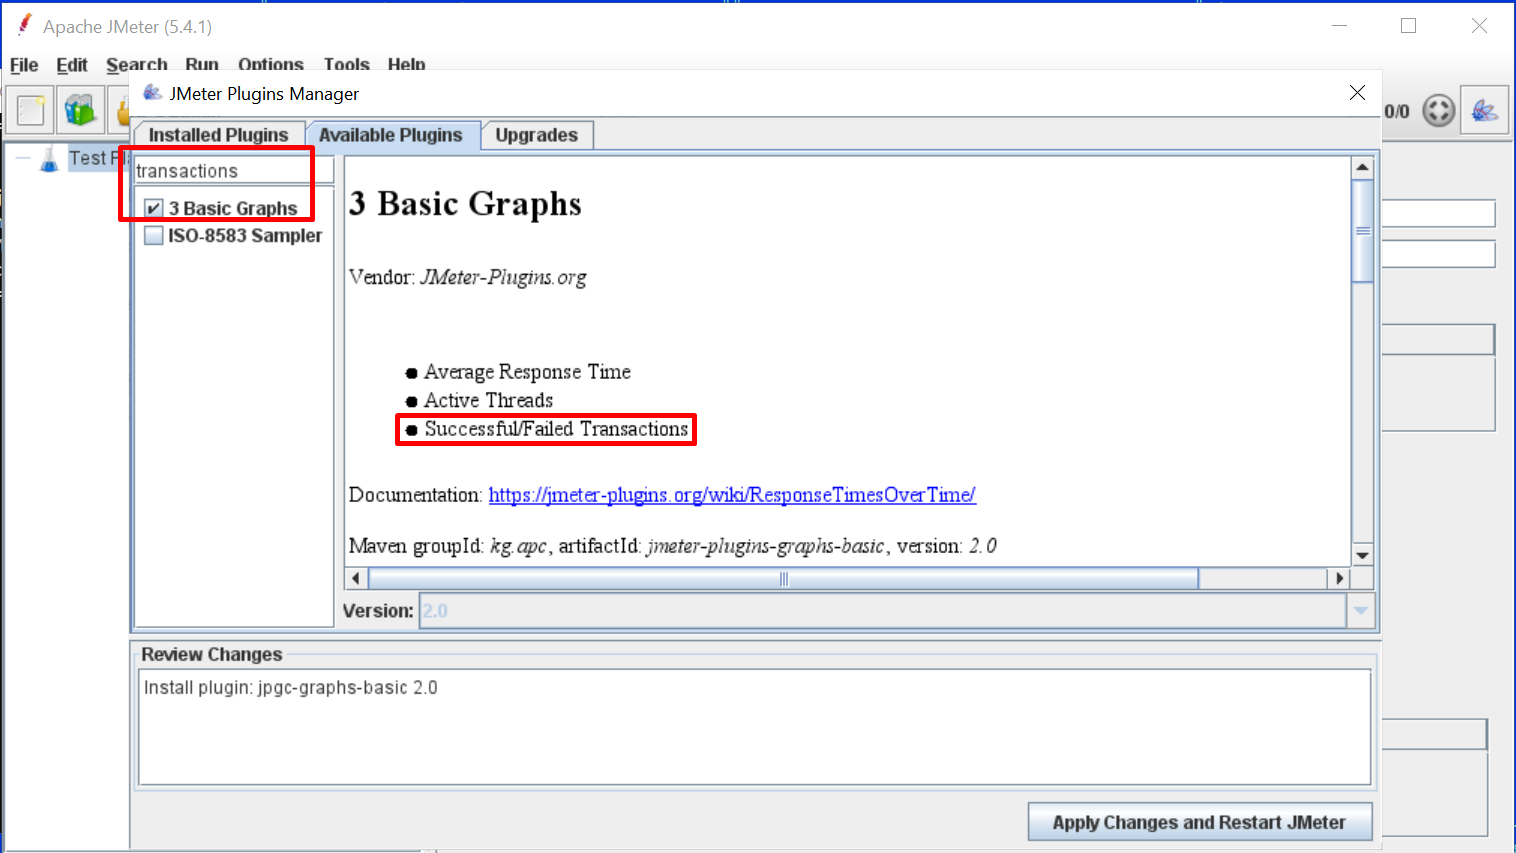
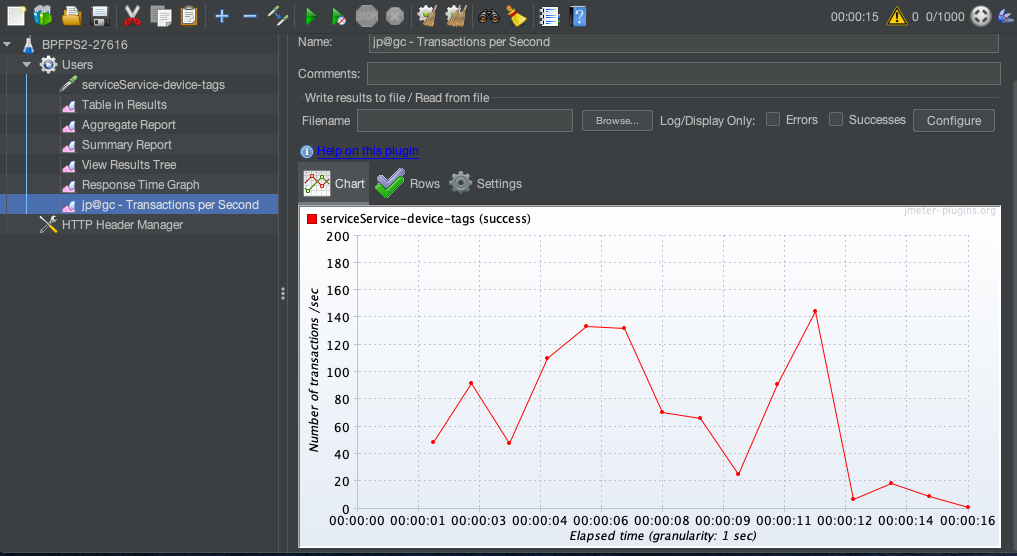
Transactions per Second chart is a part of 3 Basic Graphs bundle, the relevant Maven artifact is
kg.apc:jmeter-plugins-graphs-basic
Just type "transactions" into the filter field at the bottom left corner of the JMeter Plugins Manager GUI or look for "3 Basic Graphs" in the list and you will be able to find/install it:
DT
Sep 7, 2021, 1:35:08 AM9/7/21
to jmeter-plugins
The options are in:
- Change your monitor resolution to something higher
- Change the dimensions of the plugins manager window in the source code to match your screen resolution, recompile it and replace the plugins manager .jar with the one you compiled
- It's possible to use JMeter Plugins Manager from Command-Line or from JSR223 Test Elements
- And finally you can just resize the Plugins Manager window, it will adjust itself to your current screen resolution and you will see the buttons.
Above lines in blue are hyperlinks (just in case)
Shashikanth Channagiri
Sep 7, 2021, 12:33:48 PM9/7/21
to jmeter-plugins
Now I am getting
java.lang.ClassNotFoundException: org.apache.jmeter.visualizers.TableVisualizer
Please help
DT
Sep 8, 2021, 1:34:56 AM9/8/21
to jmeter-plugins
Are you sure you haven't removed
jmeter - Various Core Components plugin by accident?
There should be ApacheJMeter_components.jar file in lib/ext folder of your JMeter installation.
If it's not there either download and install a brand new latest stable version of JMeter or install the jmeter - Various Core Components using the aforementioned JMeter Plugins Manager.
DT
Sep 9, 2021, 2:02:35 AM9/9/21
to jmeter-plugins
Shashikanth Channagiri
Sep 9, 2021, 5:06:22 PM9/9/21
to jmeter-plugins
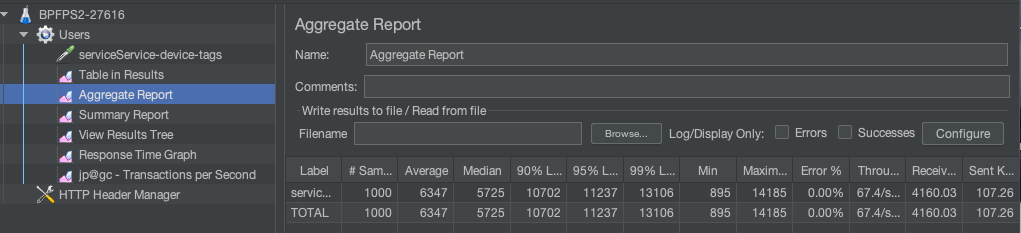
From my attachment of Aggregate Report
1000 samples
Average = 6347 milliseconds
Total Time = 1000 * 66347 = 66347000 Milliseconds = 66347 seconds
This is too high and also TSP shows 16 seconds
DT
Sep 10, 2021, 2:59:35 AM9/10/21
to jmeter-plugins
Are you sure you're able to read English and understand what's written there? The statements which are in blue are hyperlinks pointing to the useful articles and you're supposed to click the links and get familiarized with the content.
What are you trying to calculate by multiplying 6347 by 1000? Average response time is arithmetic mean of all response times (sum of all 1000 response times divided by their count)
You won't get 16 seconds of "total time" as you're running threads in parallel and total test duration is time frame between first sample start time and last sample end time.
Also don't run your test in GUI mode, it's only for tests development and debugging, when it comes to test execution you should be running JMeter in command-line non-GUI mode with all listeners disabled.
See JMeter Best Practices user manual chapter for more information.
Shashikanth Channagiri
Sep 11, 2021, 8:45:50 PM9/11/21
to jmeter-plugins
Thanks for the clarifications.
I am running Tests from command line, please let me know from which Plugin Type, can I find total time or
Latest Sample(Similar to the one in Graph Results)
Reply all
Reply to author
Forward
0 new messages