question about ISCCP-H monthly data
54 views
Skip to first unread message

Genevieve Rose Hizon Lorenzo
Apr 8, 2021, 5:51:15 PM4/8/21
to iscc...@googlegroups.com
Good day,
I downloaded some of the monthly data from
I just have some questions about the data... I'm interested in the ff data, and I want to verify if
1) after I open the data I just multiply it by 0.1 and then add 50? Then also
2) it says the fill value is 32767, but when I look at at data in matlab there are these values -7.45058059692383e-07, I'm not sure I understand.
cldamt_irtypes
Size: 360x180x3x1
Dimensions: lon,lat,cloud_irtype,time
Datatype: int16
Attributes:
long_name = 'Mean cloud amount for IR-cloud types'
units = 'percent'
valid_min = -500
valid_max = 500
scale_factor = 0.1
_FillValue = 32767
description = 'Cloud detected by IR threshold regardless of VIS threshold, IR type determined by cloud top pressure for blackbody'
standard_name = 'isccp_cloud_area_fraction'
add_offset = 50
Thank you,
Genie Lorenzo
PhD student
University of Arizona
Ken Knapp - NOAA Federal
Apr 9, 2021, 8:51:13 AM4/9/21
to grhlo...@uits.arizona.edu, ISCCP-QA
Hi
Thanks for your question.
For clarity, I went to the link you provided and selected one specific file:
I downloaded the netCDF file (the HTTPS server link).
The netCDF header shows what you sent.
When I investigate the file, I find 611 missing data grid cells with a value of 32767. I suspect that matlab performs the scaling operation when it reads in the data? Because the netCDF dump shows the values as described.
Hope this helps-
-Ken
--
You received this message because you are subscribed to the Google Groups "ISCCP-QA" group.
To unsubscribe from this group and stop receiving emails from it, send an email to isccp-qa+u...@googlegroups.com.
To view this discussion on the web visit https://groups.google.com/d/msgid/isccp-qa/CANxt9j83nLe5BOjRQUzwSvhMKotXk6RsYaUnRtu5ROxpKkA2TQ%40mail.gmail.com.
Ken Knapp,
Climatic Science and Development Branch Chief
NOAA National Centers for Environmental Information
Disclaimer: The opinions expressed in this email are those of the author. They do not necessarily reflect the official views or policies of NOAA, Department of Commerce, or the US Government.
Climatic Science and Development Branch Chief
NOAA National Centers for Environmental Information
Disclaimer: The opinions expressed in this email are those of the author. They do not necessarily reflect the official views or policies of NOAA, Department of Commerce, or the US Government.
Genevieve Rose Hizon Lorenzo
Apr 11, 2021, 8:48:04 PM4/11/21
to Ken Knapp - NOAA Federal, Genevieve Rose Hizon Lorenzo, ISCCP-QA
Thank you Ken,
Okay I guess too that matlab already does the scaling, thank you... however maybe there are some rounding errors (for those values that are
-7.45058059692383e-07 should be zero?).
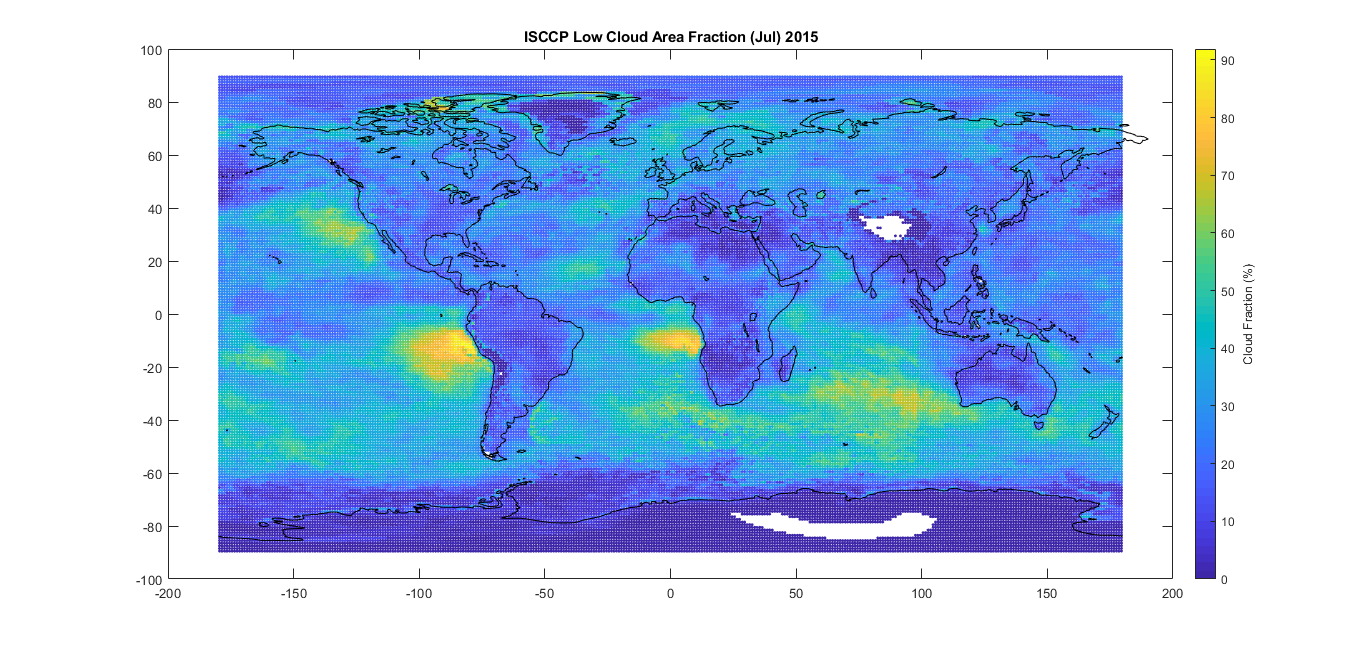
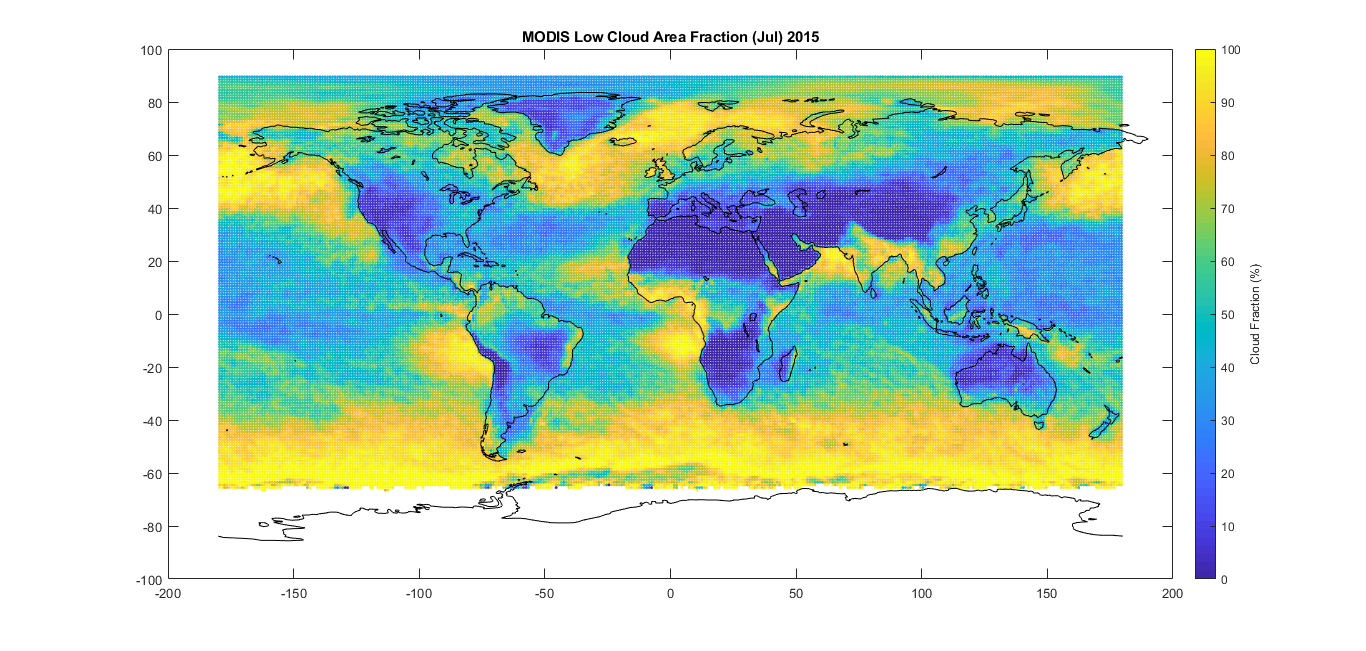
I plotted July 2015 for ISCCP (attached), and also the MODIS (MCD06COSP_M3_MODIS)
product cloud mask , and am wondering about the discrepancy and wonder if I'm looking at the same parameters.
Thank you,
Genie
Reply all
Reply to author
Forward
0 new messages