Testing set performance
36 views
Skip to first unread message

Daniel Molina
Oct 30, 2021, 2:58:13 PM10/30/21
to The irace package: Iterated Racing for Automatic Configuration
Hello
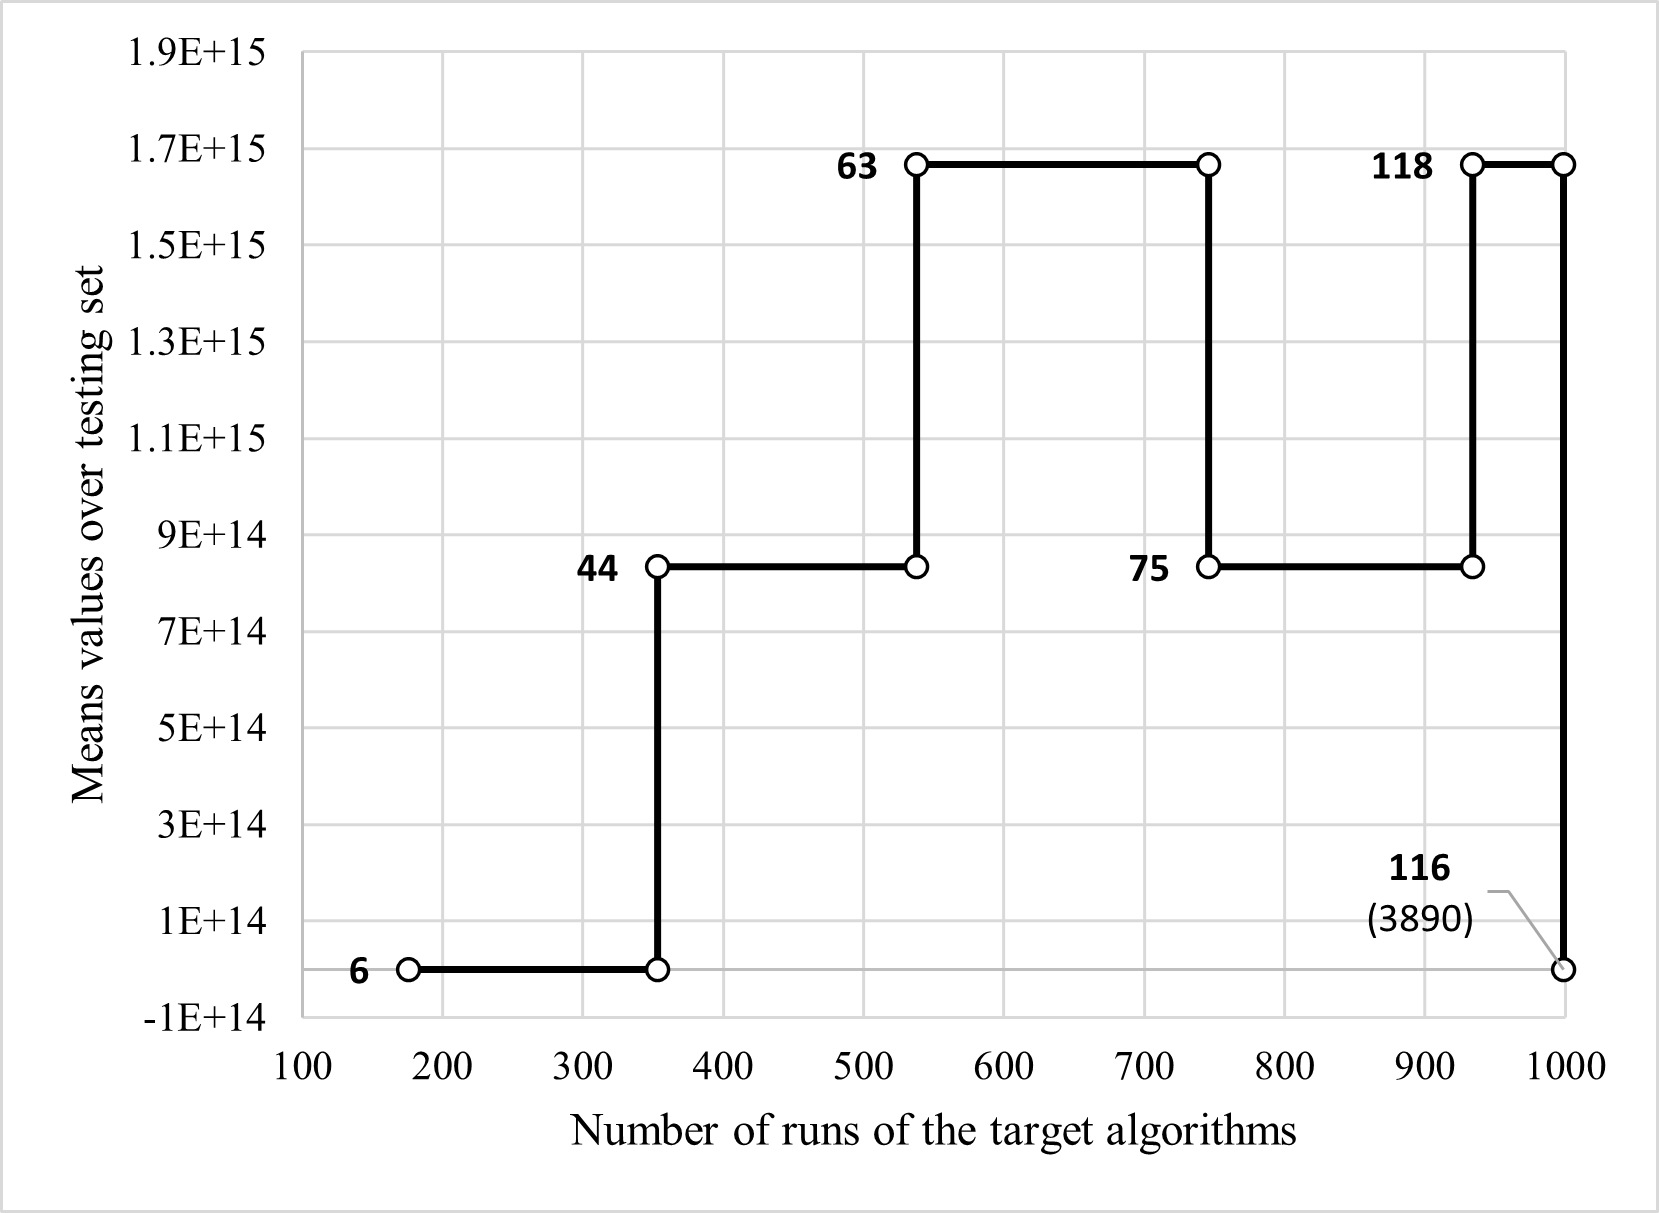
Is it normal for iRACE to return a curve of mean values from the test set in this way, without any improvement for later elite results? Is it because the algorithm is non-deterministic?

Manuel López-Ibáñez
Oct 30, 2021, 3:13:57 PM10/30/21
to The irace package: Iterated Racing for Automatic Configuration
Hi Daniel,
Without more information, it is difficult to say, but in general irace does not have access to the test set AND during the run, it only has access to a subset of the training instances AND by default testType="F-test" minimizes the sum of ranks (being good in many instances rather than optimizing the mean value). Thus, many reasons can give rise to this behavior:
* Is your training set really representative of your test set?
* Are the instances that irace see during the run representative of your test set?
* Do you have enough instances (or enough runs) in the test set to capture the expected performance? You could run again the configurations on the test set with different random seed.
* What is the variance of the configurations found by irace?
* What is the rank per instance of the configurations found by irace?
* Is irace really improving over the training set or is the performance changing wildly (which suggests that every new training instance behaves quite different from the previous seen ones?
But it is indeed surprising that configuration 6 is so good from the start. Maybe chance, but surprising.
I hope the above helps.
Manuel.
DP
Oct 30, 2021, 3:53:55 PM10/30/21
to Manuel López-Ibáñez, The irace package: Iterated Racing for Automatic Configuration
It seems to me that the test instances are enough, there are 12 problems of a benchmark. in the last iteration the metric parameters result as show. This can be classified as heterogeneous scenarios?
+-+-----------+-----------+-----------+---------------+-----------+--------+-----+----+------+
| | Instance| Alive| Best| Mean best| Exp so far| W time| rho|KenW| Qvar|
+-+-----------+-----------+-----------+---------------+-----------+--------+-----+----+------+
|x| 15| 9| 116| -4.000000000| 9|00:01:05| NA| NA| NA|
|x| 1| 9| 116| 6.500000000| 13|00:00:27|+0.00|0.50|0.4444|
|x| 2| 9| 116| 4.666666667| 17|00:00:27|+0.00|0.33|0.2963|
|x| 14| 9| 116| 3.750000000| 21|00:00:27|+0.00|0.25|0.2222|
|=| 10| 9| 75| 2223.000000| 25|00:00:29|-0.06|0.15|0.3867|
|=| 4| 9| 75| 1851.500000| 29|00:00:27|-0.05|0.13|0.3171|
|=| 6| 9| 75| 617.9168911| 33|00:00:27|-0.04|0.11|0.2688|
|=| 3| 9| 75| 540.1772797| 37|00:00:27|-0.03|0.10|0.2333|
|=| 5| 9| 75| 480.1853542| 41|00:00:27|-0.01|0.10|0.3076|
|=| 11| 9| 116| 843.6334197| 45|00:00:29|-0.03|0.08|0.3641|
|=| 7| 9| 116| 767.0303815| 49|00:00:27|-0.00|0.09|0.4163|
|=| 8| 9| 116| 1836.502267| 53|00:00:28|+0.02|0.10|0.4397|
|=| 12| 9| 116| 1710.115258| 57|00:00:29|+0.03|0.11|0.4585|
|=| 13| 9| 116| 1589.178454| 61|00:00:27|+0.03|0.10|0.4272|
|=| 9| 9| 116| 2716.581301| 65|00:00:28|+0.03|0.10|0.4513|
+-+-----------+-----------+-----------+---------------+-----------+--------+-----+----+------+
--
You received this message because you are subscribed to a topic in the Google Groups "The irace package: Iterated Racing for Automatic Configuration" group.
To unsubscribe from this topic, visit https://groups.google.com/d/topic/irace-package/31_m2laR5wg/unsubscribe.
To unsubscribe from this group and all its topics, send an email to irace-packag...@googlegroups.com.
To view this discussion on the web, visit https://groups.google.com/d/msgid/irace-package/ca2ec602-755b-4ed8-aa10-239df3ab56f1n%40googlegroups.com.
Manuel López-Ibáñez
Oct 31, 2021, 5:15:48 AM10/31/21
to The irace package: Iterated Racing for Automatic Configuration
It is difficult to say from this output, but if the instances were highly homogeneous, then rho->1, KenW-> and Qvar->0.
Moreover, the mean best appears to jump from -4 to 2000, to various intermediate values. I cannot tell from this output if the large variance is within instances or between instances, but it doesn't sound like it is converging to a specific value.
It would be interesting to plot the variance in the test set plot.
DP
Nov 1, 2021, 1:17:03 PM11/1/21
to Manuel López-Ibáñez, The irace package: Iterated Racing for Automatic Configuration
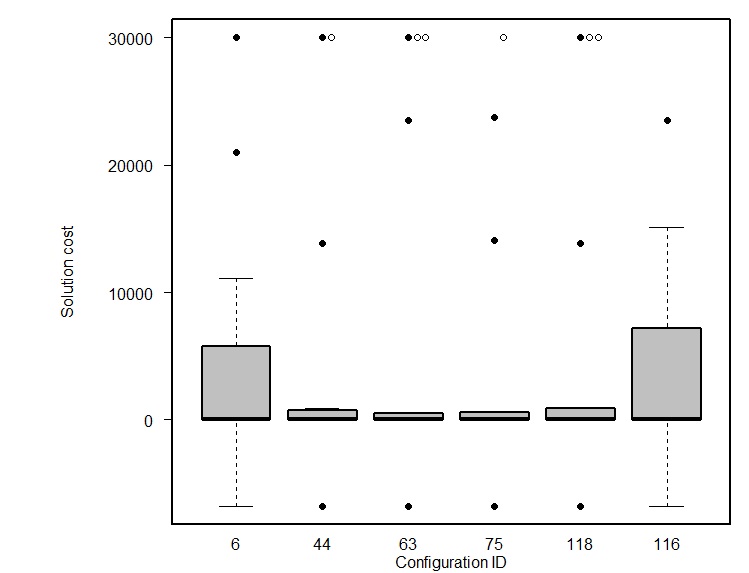
It refers to this boxplot, I made some changes to it, for example, the white dots means that no feasible solution was found in the instance. the results can range from -6000 to 30,000, can that affect convergence?
You received this message because you are subscribed to the Google Groups "The irace package: Iterated Racing for Automatic Configuration" group.
To unsubscribe from this group and stop receiving emails from it, send an email to irace-packag...@googlegroups.com.
To view this discussion on the web, visit https://groups.google.com/d/msgid/irace-package/066e42e3-0f5b-4bad-a64b-d08e133a6797n%40googlegroups.com.
Manuel López-Ibáñez
Nov 1, 2021, 1:40:43 PM11/1/21
to The irace package: Iterated Racing for Automatic Configuration
It would be better to use a violinplot or plot the original points jittered so that we can see the actual distribution. However, looking at these boxplots, how can you tell which configuration is better? Which one will you choose? What would a statistical test choose?
Can you do the same violin plot over all the training instances that irace was able to see during its run? (That is, the training instances that 116 saw).
Are you using testType="F-test" or testType="t-test"?
One possible issue is that, if the outliers are infrequent (the violin plot would clarify this), but they impose such a massive penalty (when you wish to compare means), it may be a matter of luck whether irace noticed the outlier for a particular configuration or not. It may be that no outlier was generated at all during training for the winning configurations of each iteration, but then when testing we can see that some configurations do generate more outliers and infeasible solutions than others. In that case, I don't know of any other solution except increasing the number of runs/instances seen before elimination with firstTest to account for the noisy performance.
Also, I don't understand how this boxplot matches the original plot you provided. In the boxplot the maximum value is 30,000. In the original, a few mean values were 1.7e+15.
Cheers,
Manuel
DP
Nov 1, 2021, 6:23:46 PM11/1/21
to Manuel López-Ibáñez, The irace package: Iterated Racing for Automatic Configuration
I use the Ftest test. The difference between the two plots is that, in the first plot I assume the non-feasible results as a high value (10 ^ 16) however in the box plot I do not use those values, I only point them out: I now attach a violin plot just as you recommend. Here, as you say, I can better observe the average values. The white dots above are not feasible solutions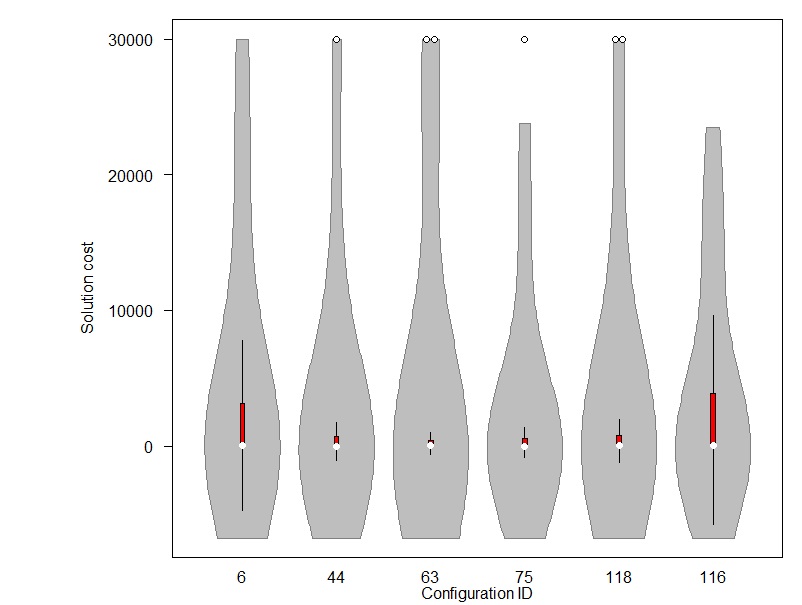
To view this discussion on the web, visit https://groups.google.com/d/msgid/irace-package/a2043292-72a2-4ce0-bcc0-b594440eaaa0n%40googlegroups.com.
Reply all
Reply to author
Forward
0 new messages