overlapped label of genes in IGB
25 views
Skip to first unread message

Xiao Lei
Nov 3, 2021, 10:53:07 PM11/3/21
to Integrated Genome Browser Help Desk
Hi, Everyone,
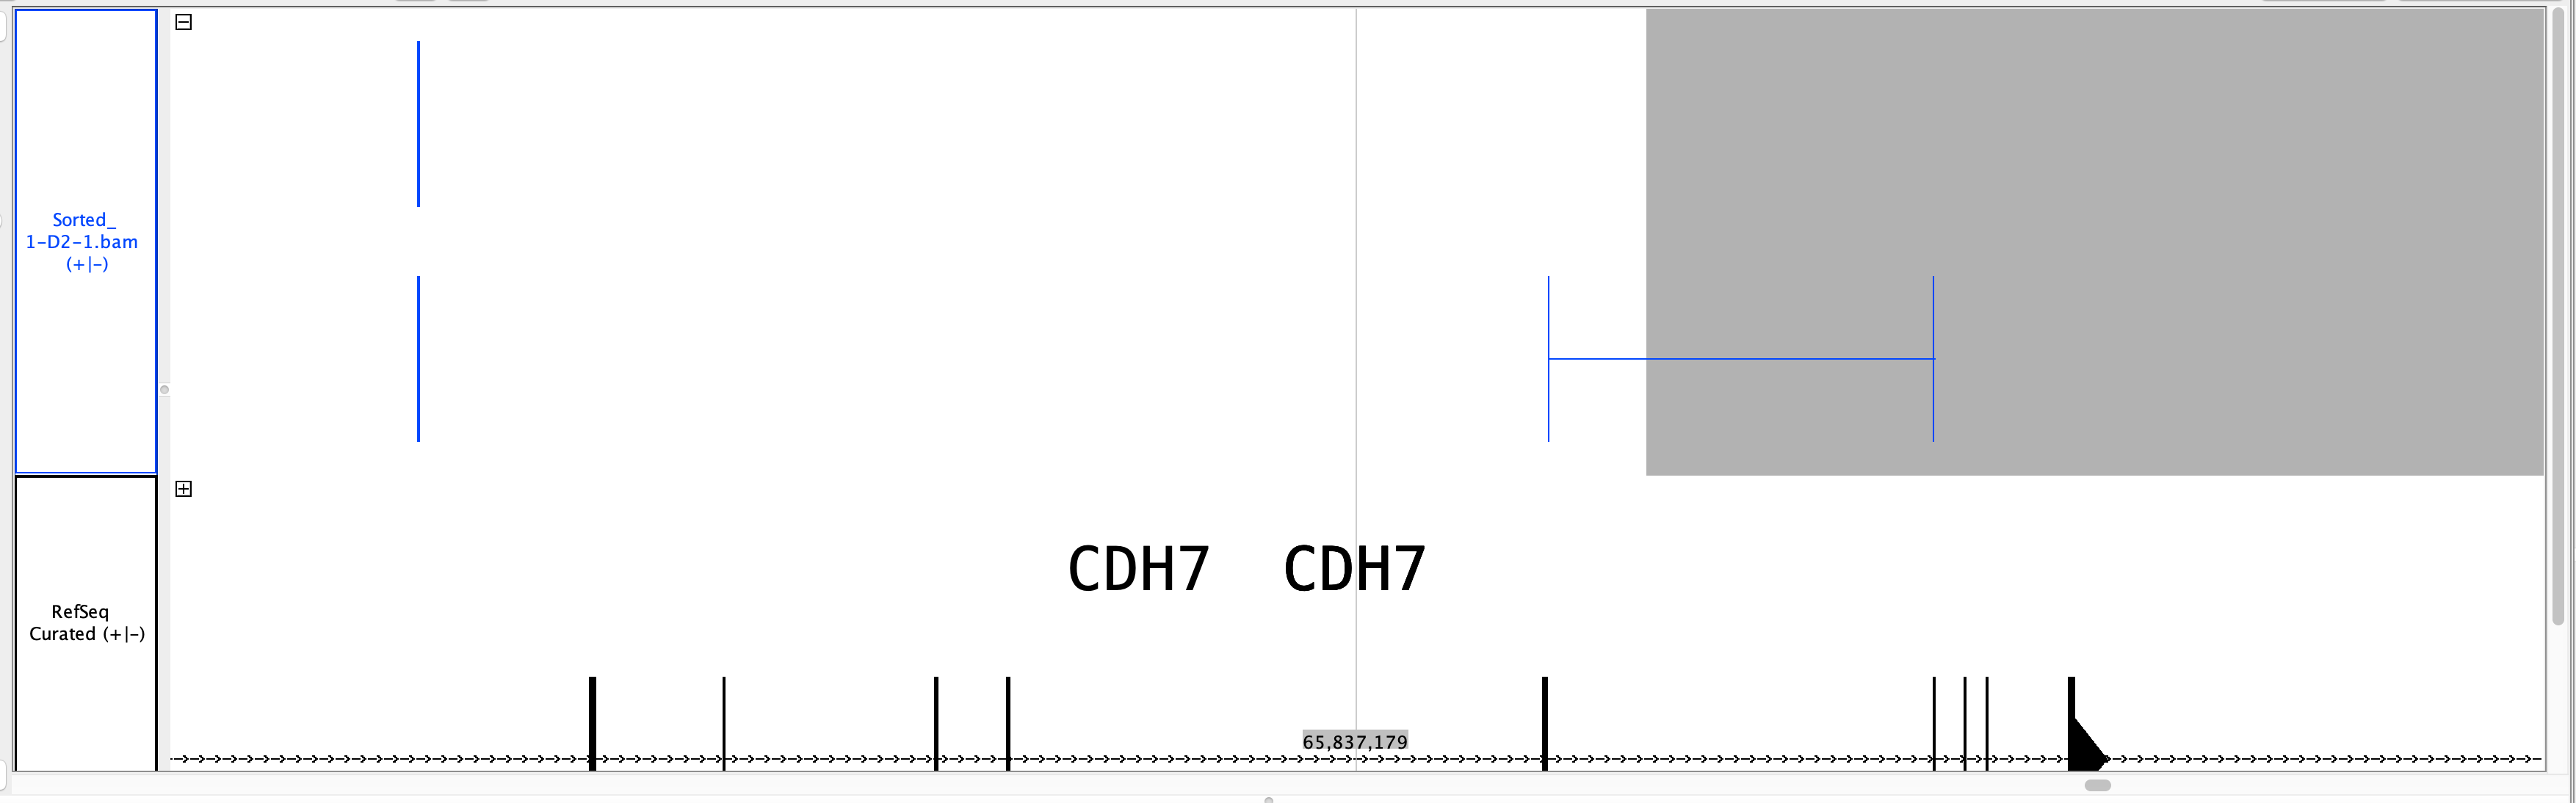
I am a newbie to IGB browser, I used IGB to browse genes in the human genome. I found somehow IGB could not show genes labels correctly (the same location two labels overlaid with each other, image attached). After I zoom in, I can see somehow IGB put two labels of the same gene (attached example for gene CDH7). Can I adjust the label font? Can I ajust that for a given gene, only one label is shown?
Thanks,
Xiao

Ann Loraine
Nov 4, 2021, 11:57:28 AM11/4/21
to Integrated Genome Browser Help Desk
Hi,
The reason the labels are shown as overlapping is because the gene model track is currently in "collapsed" view mode.
In "collapsed" mode, all annotations are drawn in a single row. This means that gene models that overlap along the horizontal axis will be drawn on top of each other, included the labels.
The opposite of "collapsed" mode is "expanded" mode, which is the default state for an annotation track when you first load it.
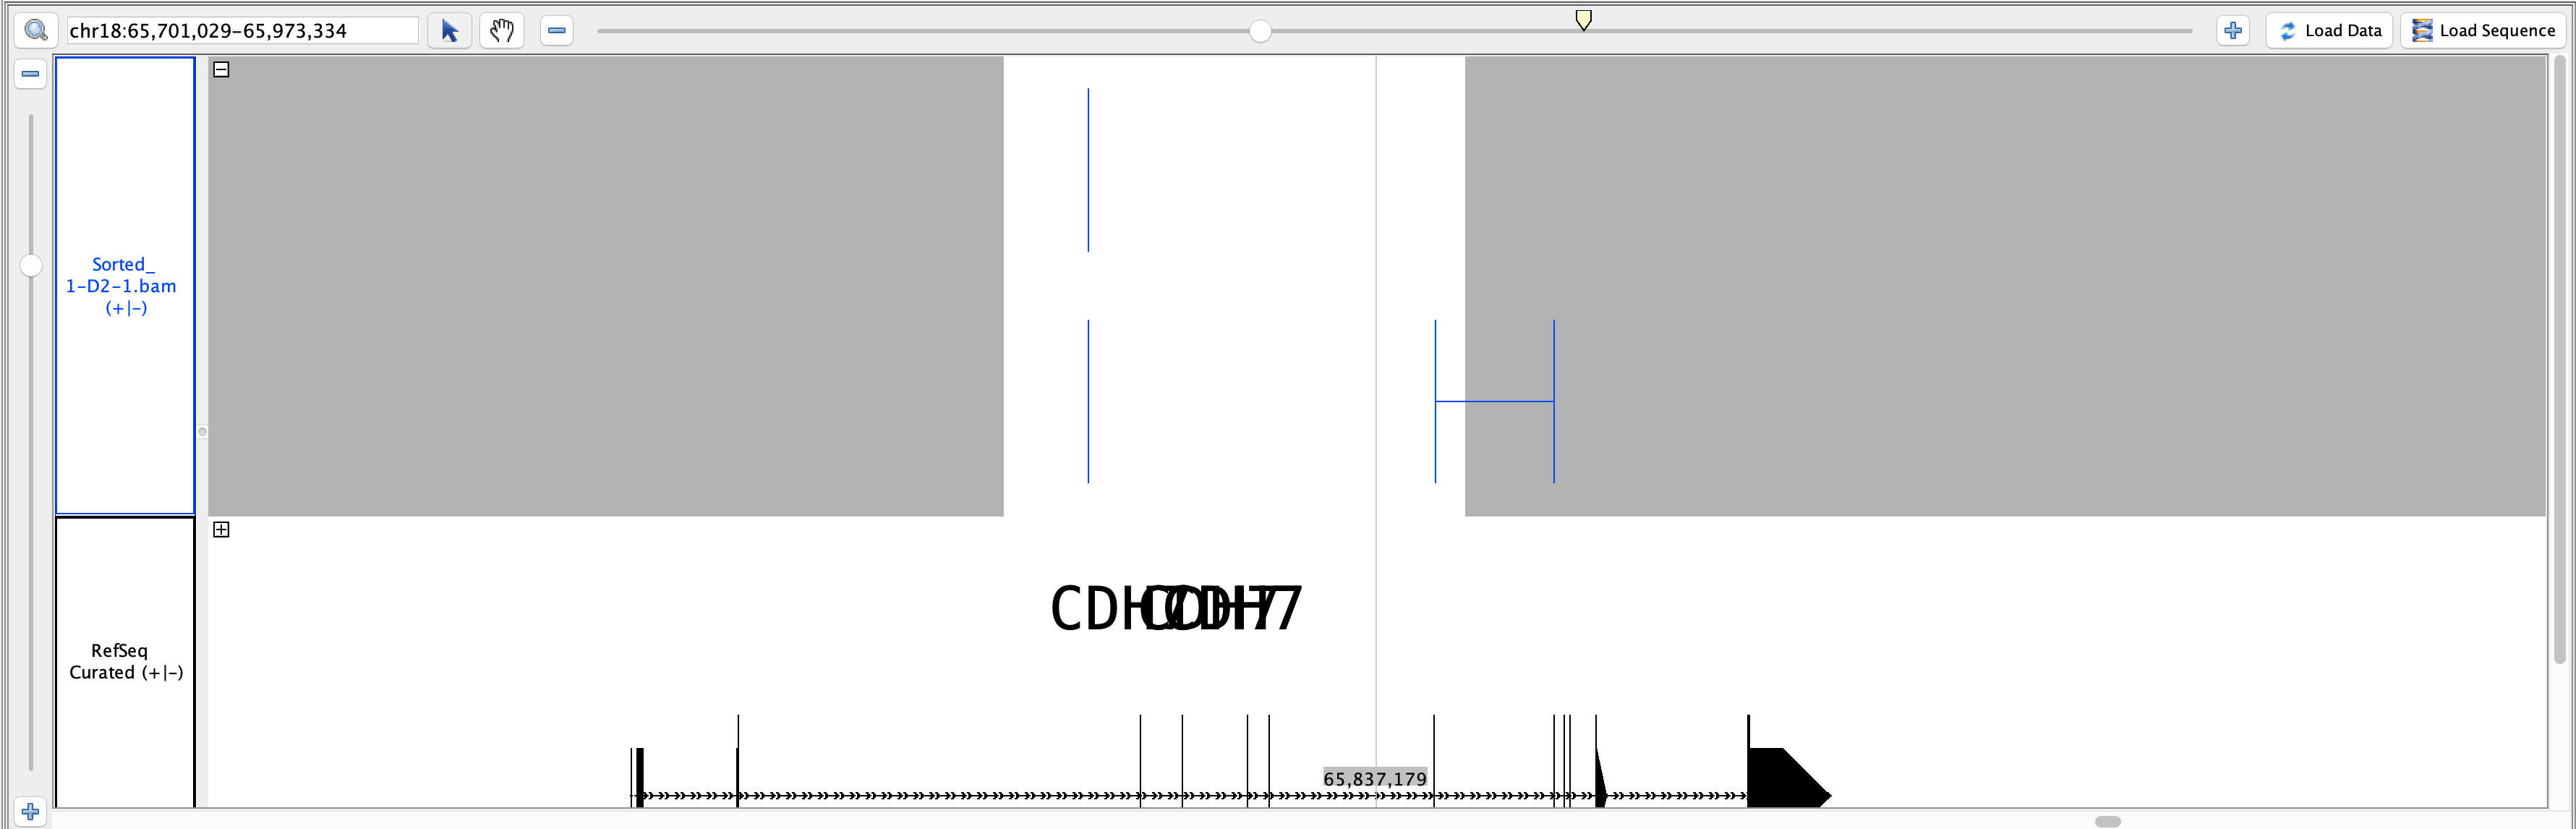
To get back to "expanded" mode, click the tiny plus sign shown in the top left corner of the track.
I'm attaching an edited version of your second screen shot that shows where to click.
Also please see how each track (except for graph tracks) has a tiny "collapse/expand" in the same location relative to the track that lets you switch between the two modes. I use these a lot when I'm looking at lots of tracks. It's most useful as a way to save vertical space. When I'm not focusing on a particular track, I collapse it, and this gives the other tracks that a lot more vertical space.
Last but not least, I wanted to mention that IGB has a concept of "stack height" for annotation tracks, which you can control and can be very useful when making figures for publication or slides. If you're working with a BAM file from an RNA-Seq experiment, there can be hundreds or even thousands of sequence alignments in regions with highly expressed genes. Often you want to control how many of these are actually shown. You can control this by altering the "stack height", which you can do via the Annotation tab or the shortcut icons in the top left of the window. (Hover the mouse over the shortcuts to find the ones related to stack height.) For example, if you set stack height to 20 for a track, then a maximum of 20 items will be shown individually in stacks within a track, and all the rest will be draw on top of each other in the very top row of the track, called the "slop" or "summary" row.
- Ann
Reply all
Reply to author
Forward
0 new messages