IGB depth graph for customer genomes
38 views
Skip to first unread message

Xiao Lei
Mar 30, 2022, 5:02:10 PM3/30/22
to Integrated Genome Browser Help Desk
Dear IGB community,
Is there a way to show depth graph for customer genomes? I can load the genome and sorted bam file into IGB without problem, but all the options under "Graph" tab are greyed out (attached image), I would like to see depth graph of the genome, is there a way I can do?
Thanks ahead,
Xiao

Nowlan Freese
Apr 7, 2022, 2:30:40 PM4/7/22
to Integrated Genome Browser Help Desk
Hi Xiao,
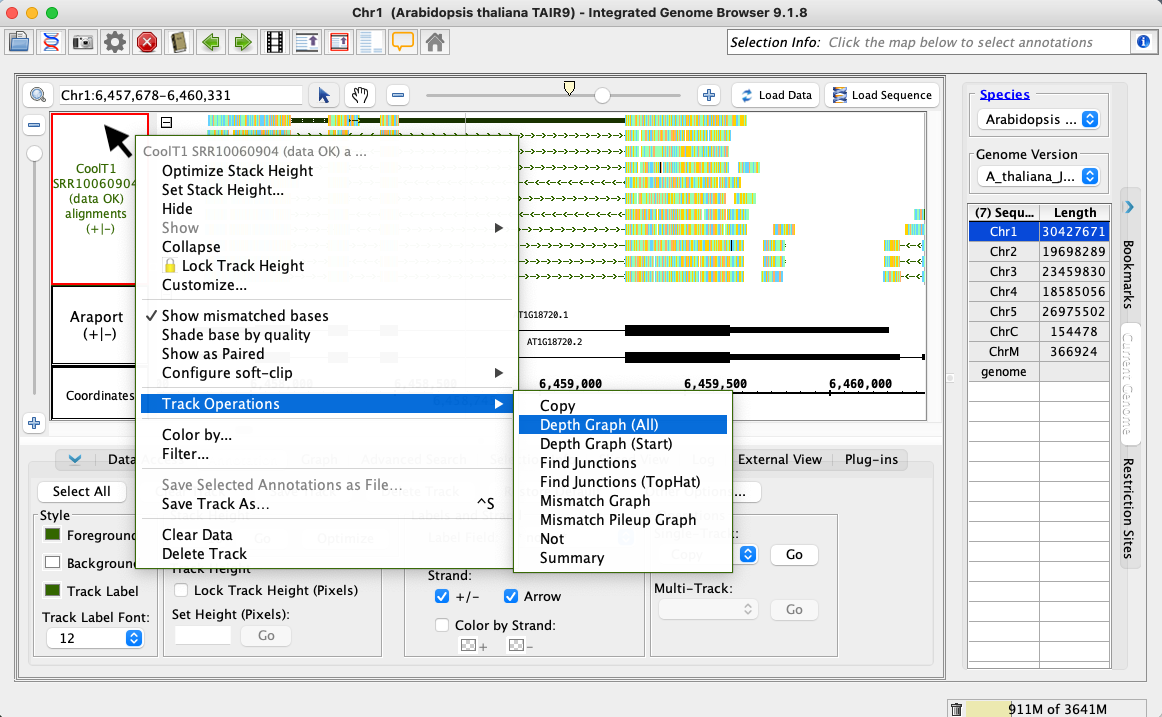
You can create a depth graph from a bam file using IGB Track Operations.
To create a depth graph:
Right-click on the track's label on the left side of IGB (CLIP33BC1_M1T.sorted.bam in your example).
Highlight Track Operations in the right-click menu and select Depth Graph (All).
This will create a new track with the depth graph information.
Additional information can be found in the IGB User's Guide here: https://wiki.bioviz.org/confluence/display/igbman/Creating+graph+tracks+from+annotations+tracks
Let me know if this helps or if you have any other questions!
Best,
Nowlan
Reply all
Reply to author
Forward
0 new messages