Interpretation of EIS time constants of an oxide layer?
Gokul OS
Hello all.
I have collected few electrochemical impedance spectra of Cr2O3-based oxide layer formed during high temperature oxidation of alloys in a non-aggressive electrolyte. The qualitative Bode phase angle plot exhibits around 3 time constants (CPE peaks at high-, mid- and/or low- frequencies) indicating various dielectric features within the oxide layer. Generally, I attribute the time constant in the high-frequency region (above 103 Hz) with that of the bulk oxide because of its lower capacitance (from high thickness). Meanwhile, the other time constants located in the mid- and/or low-frequency time constants look complicated, though I suppose it must be the response from nano-porous fractured paths observed in the oxide that may have electrolyte accommodation till the metal-oxide interface.
The general oxide models (porous and sandwich structured)1 seems
irrelevant when much electrical components needed to be added for
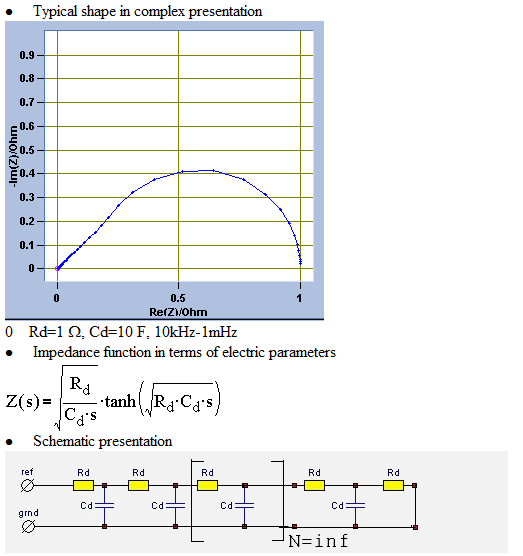
fitting spectra with much dielectric components. Also it seems that the transmission line model cannot be applicable in this case because of the multiple time constants observed here. In this regard, how can I associate these time constants with their respective dielectric features?
Thank you.
Reference:
1. Characterization of High-Temperature Oxide Films on Stainless Steels by Electrochemical-Impedance Spectroscopy (1998).
Yevgen Barsukov

Yevgen
--
You received this message because you are subscribed to the Google Groups "Impedance Spectroscopy" group.
To unsubscribe from this group and stop receiving emails from it, send an email to impedance-spectroscopy+unsub...@googlegroups.com.
For more options, visit https://groups.google.com/d/optout.
Gokul OS
Thanks for your reply. The objective of my EIS analysis was to study the structure of oxide layer after corrosion in a non-aggressive buffer solution. In this case no corrosion or charge transfer process would be expected when EIS was measured at OCP. Though no vertical line behavior at low frequencies observed as you said, aren't the corrosion processes (fast electron transfer process) are expected in the high frequency region?
In my situation, I am trying to determine the reasons for those multiple relaxation features observed, though no corrosion processes were involved. Also I could not find relevant literatures with multiple time constants (R-C) fitted with transmission line model. It would be great if you suggest me few references for determining the physical meaning of those relaxation features.
Thank you.
Regards
Gokul.
