ChIP-Seq pipeline in "tf" mode
100 views
Skip to first unread message

Asma Riyaz
Oct 14, 2020, 9:36:14 AM10/14/20
to idr-discuss
Hello,
I have a couple of questions regrading the output and its interpretation:
1) The peak files obtained are suffixed with "regionPeak" and not "narrowPeak". Could you help me understand why this would be the case? The output of call-reproducibility_idr has 10 columns and not 9 (as is mentioned in the format description for broad/region peak). Here is an excerpt from the output.
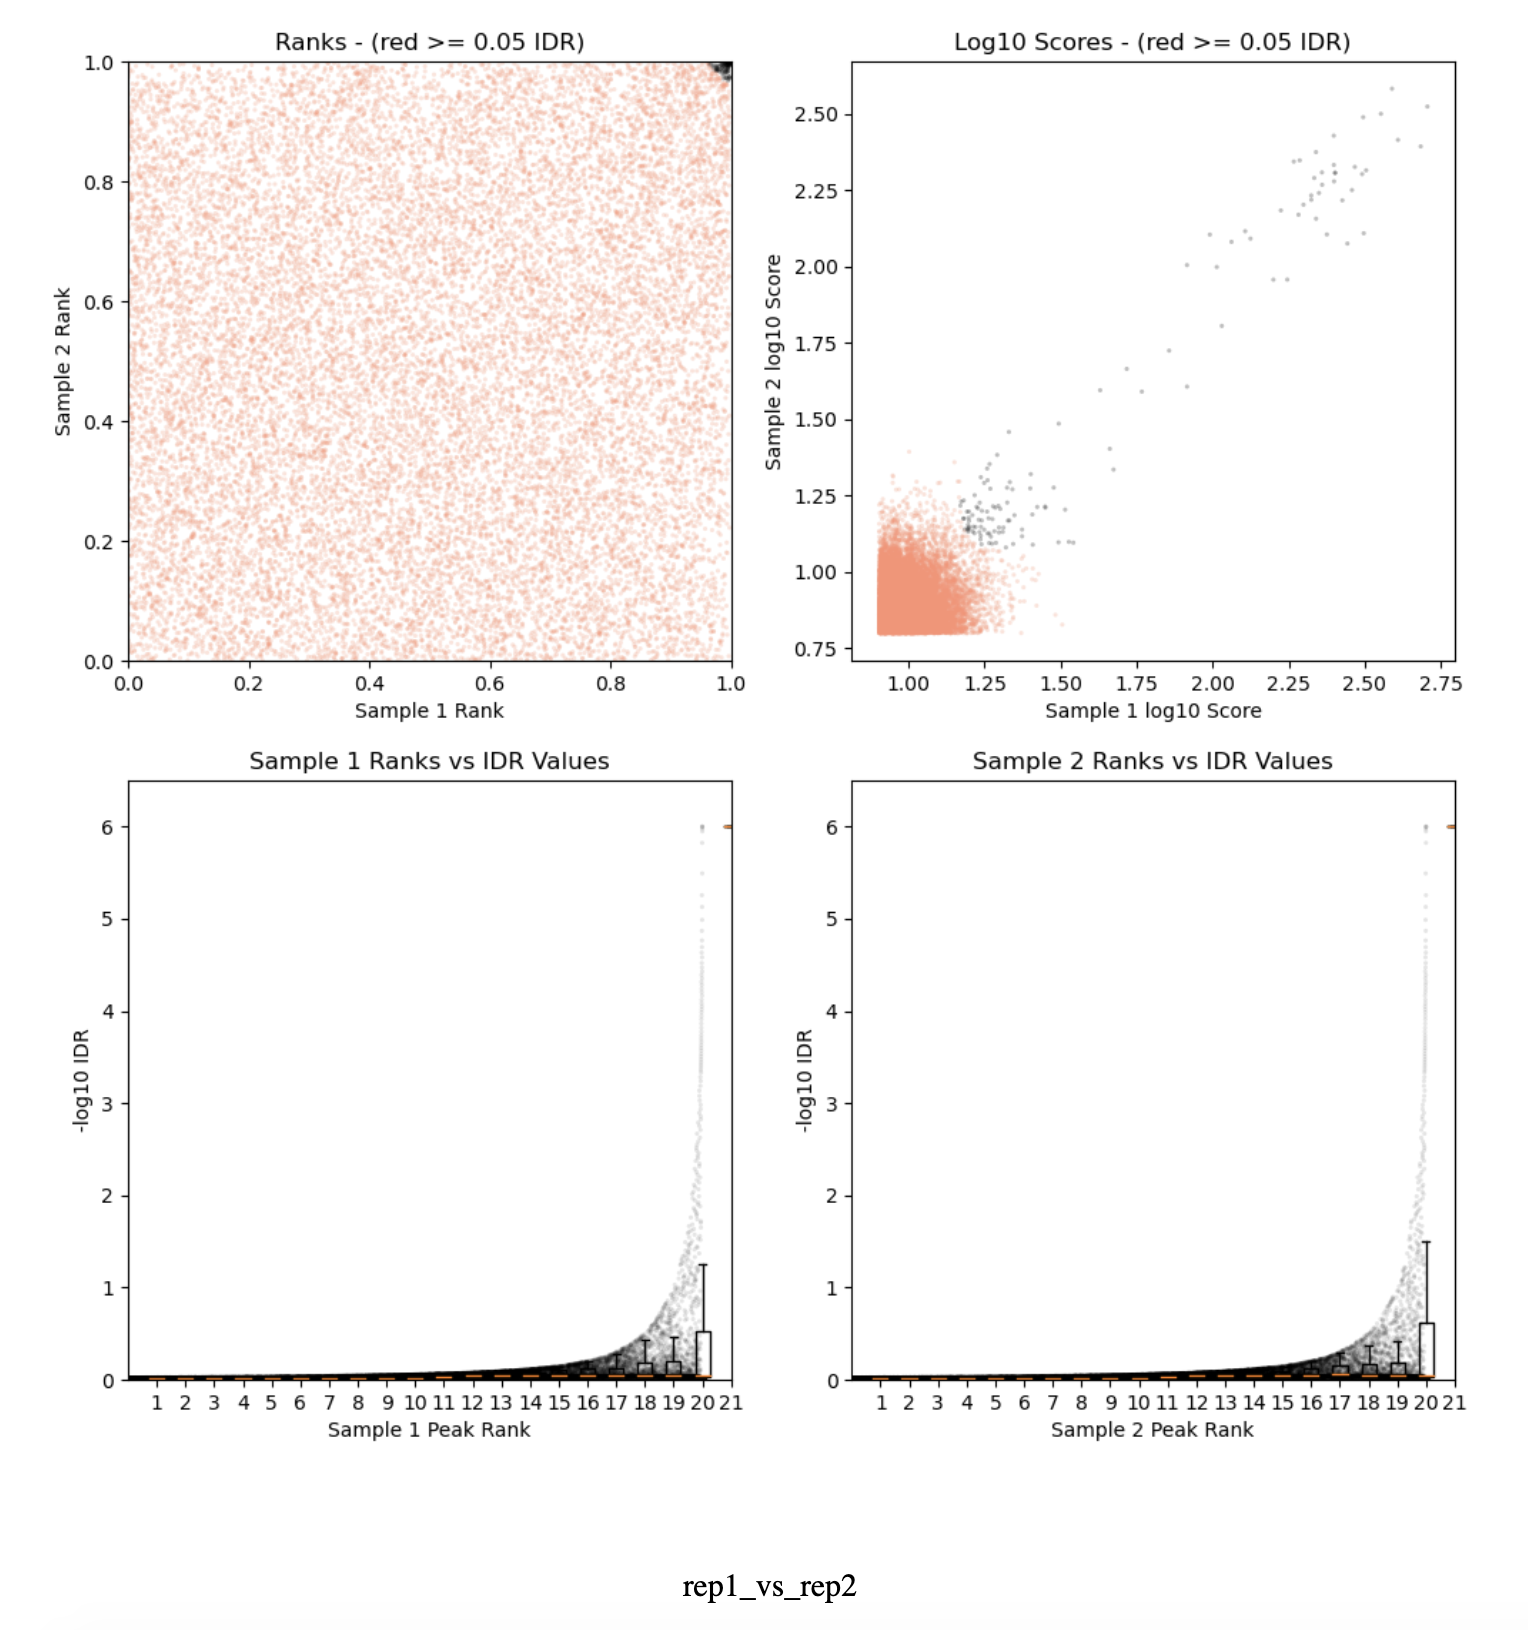
2) The IDR plots of all 3 samples show very little black dots as compared to the tutorials I have found online. Why would this be the case? Is it because the regions found from this protocol are broad instead of narrow? I have attached a plot here for reference.
3) While I understand the conservative peaks refer to peaks only from the replicates and optimal peaks come from both replicates and pooled samples, I was hoping to understand which set to consider for downstream analysis as there are very few black dots in my case in the IDR plot?
I have attached the qc report for one of the samples BZW1 with this thread in case you may find it useful to help me.
Thank you,
Asma
Reply all
Reply to author
Forward
0 new messages