problem with graphing response curves
27 views
Skip to first unread message
Nina Nikolic
Feb 25, 2016, 8:17:20 AM2/25/16
to HyperNiche and NPMR
dear HyperNiche Team,
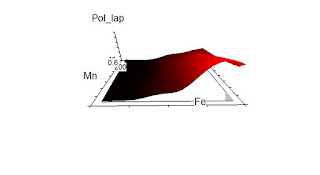
since i reinstalled my hyperniche on my new laptop and downloaded the fixes (version 2.29 running), i am experiencing a huge inconvenience with 3d graphing of my selected models. namely, the PROJECTION response curves have a problem with axis labelling. the labels of my axes are all clumped in one spot (where all the 3 axes intersect), and can not be moved from that point no matter what i do. i have checked data range and axes labelling options, everything seems normal, but i can not produce a useful projection 3d graph. i have used hyperniche since 2013 (not on a regular basis, but anyway), and i have never experienced this problem.
PLEASE HELP!
for the illustration, i paste one 3d projection graph with the messed axis labels (please see above)
Bruce McCune
Feb 25, 2016, 10:35:48 AM2/25/16
to hyper...@googlegroups.com
I'm not sure what is causing this, I will do a little more checking, but please try this first:
Outside of HyperNiche:
Check Hide labels that are behind graph.
Check Label one axis side so there are no labels behind the graph
Uncheck Adjustable labels
Outside of HyperNiche:
- Right click on empty part of screen
- Select Personalize
- Select Window color and appearance
- Select another Color scheme (not sure what you will be offered, but don't choose aero or Vista standard)
Check Hide labels that are behind graph.
Check Label one axis side so there are no labels behind the graph
Uncheck Adjustable labels
- Bruce McCune
--
You received this message because you are subscribed to the Google Groups "HyperNiche and NPMR" group.
To unsubscribe from this group and stop receiving emails from it, send an email to hyperniche+...@googlegroups.com.
For more options, visit https://groups.google.com/d/optout.
Nina Nikolic
Feb 26, 2016, 8:32:39 AM2/26/16
to HyperNiche and NPMR
dear prof mccune, thanks a lot for a prompt answer, as always!
unfortunately, your suggestion did not solve the problem.
moreover, i have discovered the same problem with 3d graphing in PCORD!
again, the axes labels (not axes names vis Axis 1,Axis 2), but the thick labels (numbers along axes) are clumped in one point of the graph instead of being normally spread along axes.
my problem began since i got the new laptop with windows 7 professional (i had windows home edition previously).
i tried at my colleague's comp running windows 10 and encountered the same problem, both with pcord and hyperniche 3d graphing.
PLEASE HELP!
Nina Nikolic
Feb 26, 2016, 8:36:19 AM2/26/16
to HyperNiche and NPMR
an update: on a mac computer with windows 7 home installed (bootcamp) everything works ok.
i assume that newer windows editions are making the troubles.
hope it could be solved by the great mjm team!
i assume that newer windows editions are making the troubles.
hope it could be solved by the great mjm team!
On Thursday, 25 February 2016 14:17:20 UTC+1, Nina Nikolic wrote:
Nina Nikolic
Mar 11, 2016, 1:35:23 AM3/11/16
to HyperNiche and NPMR
with the new hyperniche 2.30 now everything works fine.
you are the best in the world!
thanks.
you are the best in the world!
thanks.
Reply all
Reply to author
Forward
0 new messages

