MR3 Using Prometheus
54 views
Skip to first unread message

Carol Chapman
Jan 11, 2022, 1:11:47 AM1/11/22
to MR3
HI,
Now i run a Prometheus to report the statistics on DAGs as well as the states of Java VM. I want to show these indicators in grafana, How can I get the mr3 metrics template? And If grafana is not suitable, what component do you recommend me to use to display indicators?

Sungwoo Park
Jan 11, 2022, 2:45:22 AM1/11/22
to MR3
Grafana is okay to use. For watching Hive-MR3, Grafana and MR3-UI are available. HiveServer2 Web-UI is not useful, and we would not recommend it.
The upcoming MR3 1.4 release will include a Docker image for running Timeline server, MR3-UI, Prometheus, and Grafana on Kubernetes. We are currently trying different metrics templates for Grafana. Let me upload a sample template here when it is ready.
Cheers,
--- Sungwoo
Carol Chapman
Jan 11, 2022, 3:00:16 AM1/11/22
to MR3
That sounds great !
TEZ-UI does not support timeline server V2 API.
So I can’t use mr3-ui on Hadoop 3 at the moment. If i can use MR31.4 Docker Image, I can use hive with out hadoop env.
But now I can only use Prometheus + Grafana to view monitoring information.
At present, I am setting up the grafana panel myself, which may be relatively simple. It would be better if I could use the template provided by you.
Sungwoo Park
Jan 14, 2022, 5:04:18 AM1/14/22
to MR3
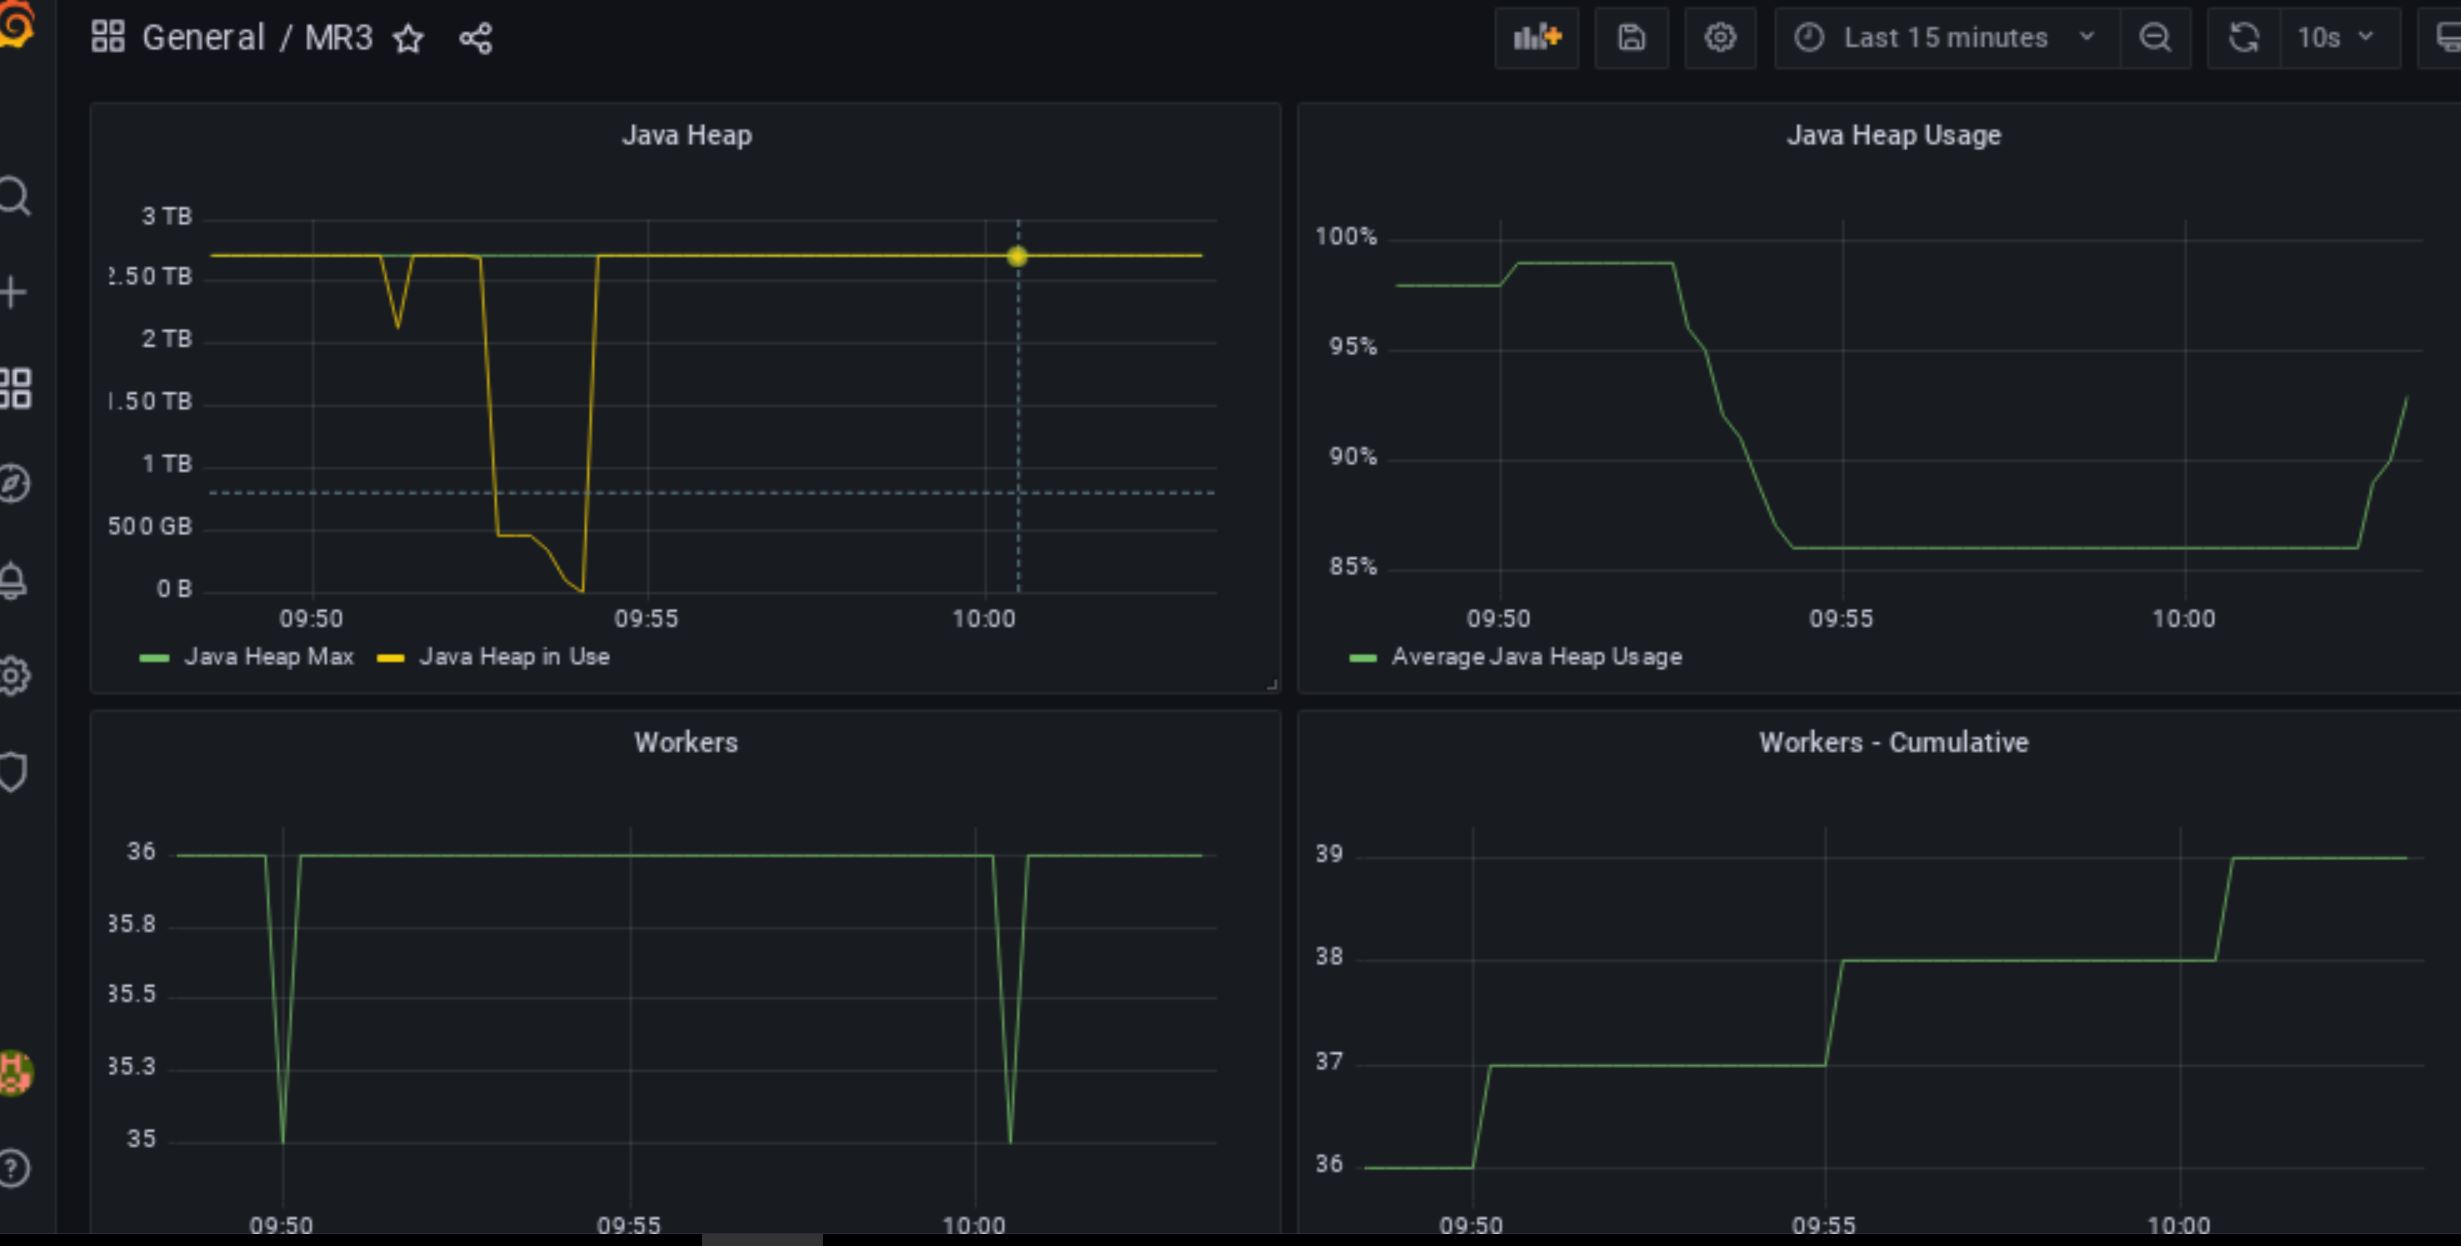
Attached is mr3.json which defined a Grafana dashboard MR3 with 8 panels. One of the panels (DAGs - Cumulative) is not going to be updated properly because of three Prometheus metrics not published in MR3 1.3 (introduced in MR3 1.4). Hope this will be useful as a basic template for Grafana. It is useful for watching autoscaling of MR3.
Cheers,
--- Sungwoo
Carol Chapman
Jan 18, 2022, 2:18:19 AM1/18/22
to MR3
Thank you!
Reply all
Reply to author
Forward
0 new messages