HikariCp Metrics Explanation
1,109 views
Skip to first unread message

Himanshu Dahiya
Feb 21, 2022, 11:24:06 PM2/21/22
to HikariCP
Being new user of HikariCp i have following question.
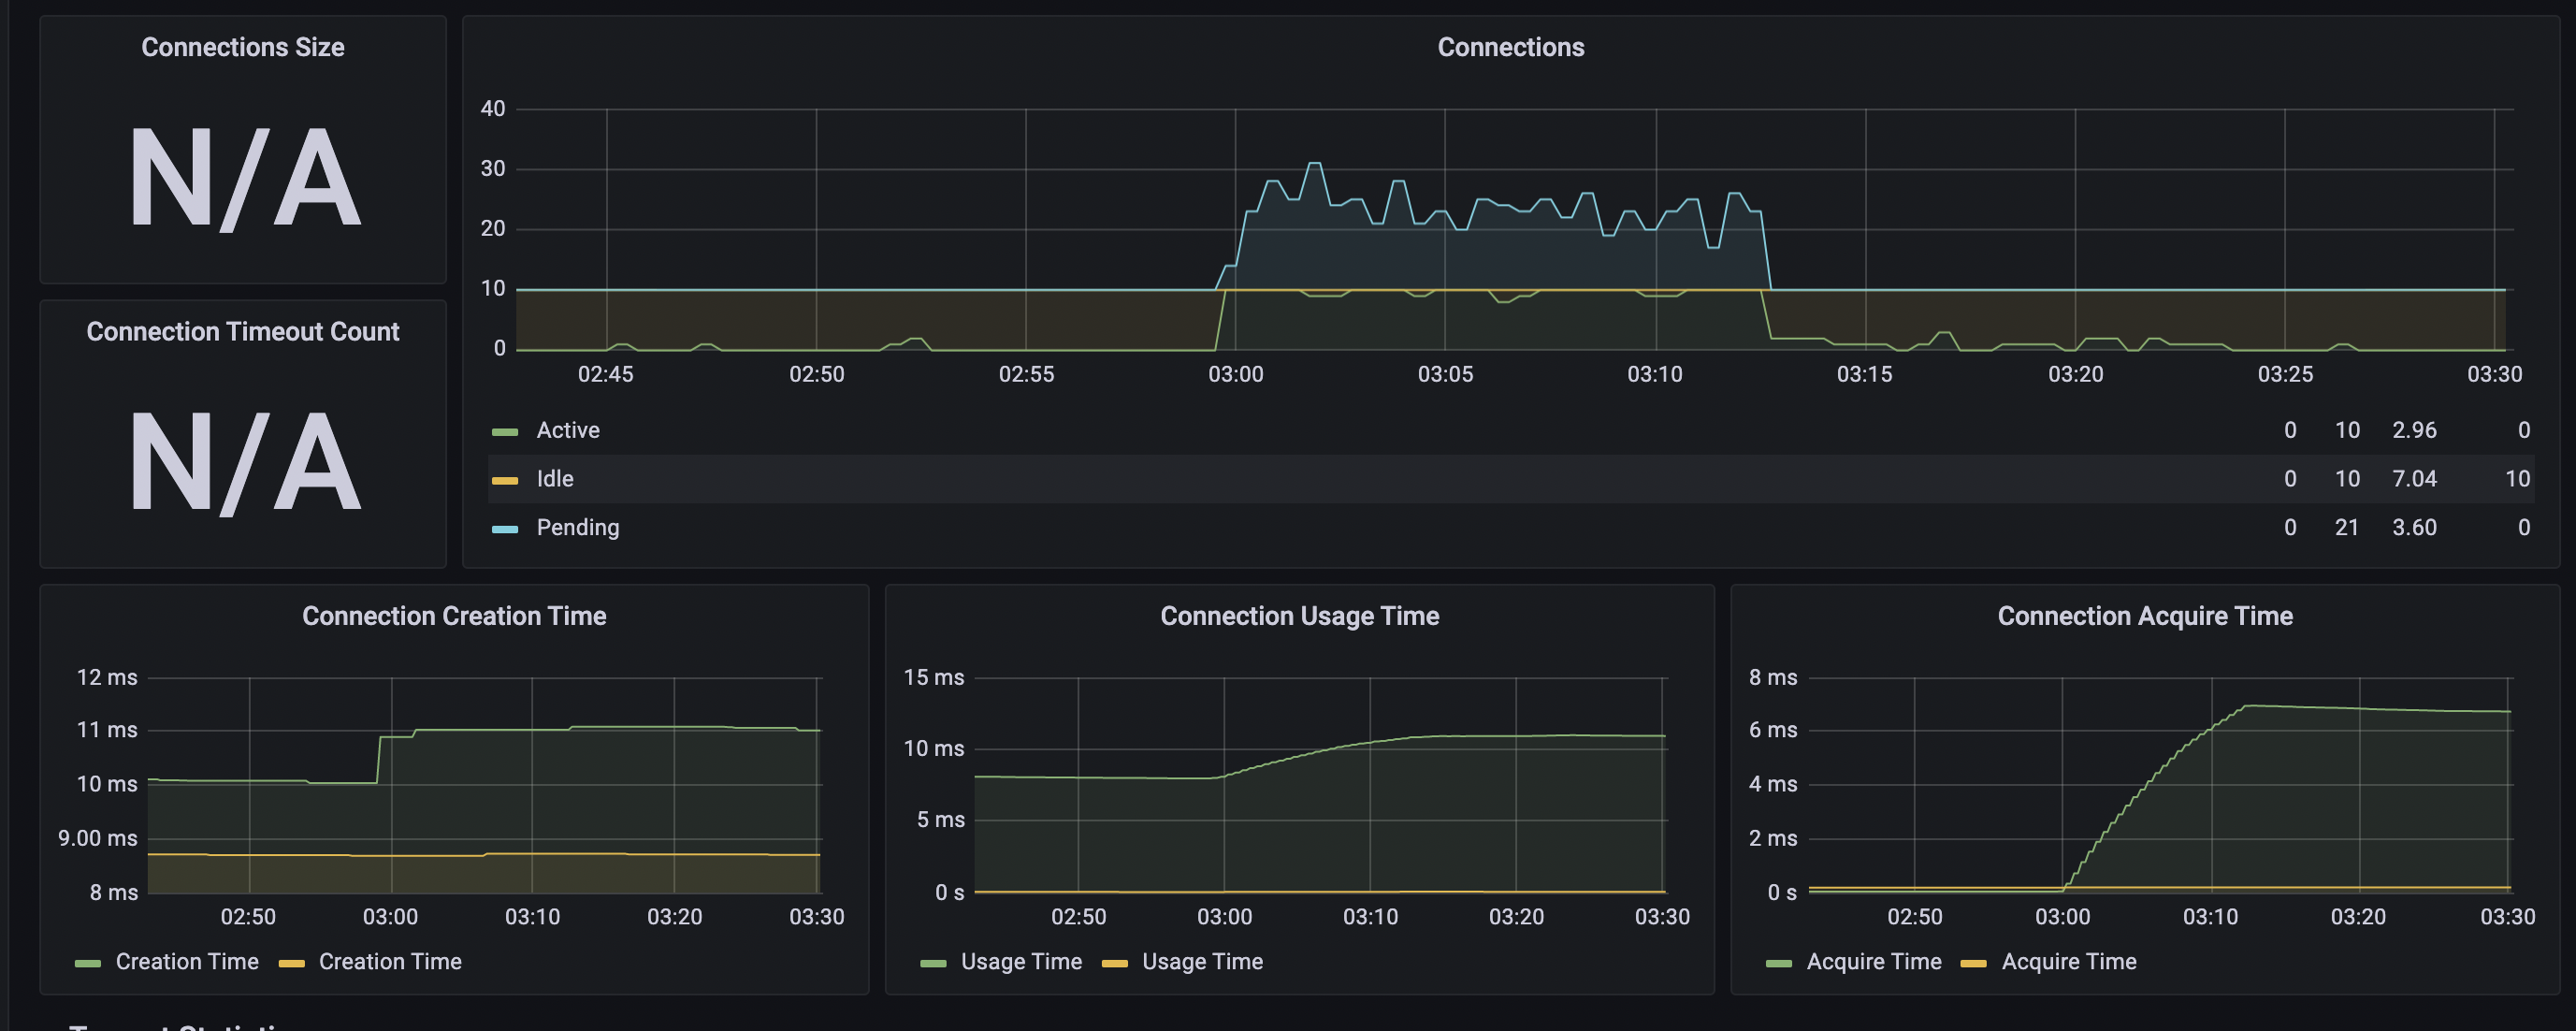
In one of our application, We are using HikariCp pool for mysql connections, maximumPoolSize is set to 10. During some time in the day, we have above symptoms i.e. Pending Connections go till 30 (blue line in right top view) where as connection usage time and acquire time remains in milliseconds. In my view, this looks normal behaviour as HikariCp recomends (https://github.com/brettwooldridge/HikariCP/wiki/About-Pool-Sizing) i.e. Axiom: You want a small pool, saturated with threads waiting for connections. Can anybody confirm my understanding?
What should be the right alert threshold where we should start seeing whats happening in our application?
Reply all
Reply to author
Forward
0 new messages