Number of trials and model fit
299 views
Skip to first unread message

Zhamilya Gazman
Apr 20, 2021, 3:40:41 PM4/20/21
to hddm-users
Hi all, hope all is well.
Thank you for creating this tool and the forum! It has been exciting to learn about hddm. I have explored the existing forum questions, but could not find an answer to some of the (very) beginner questions that I have.
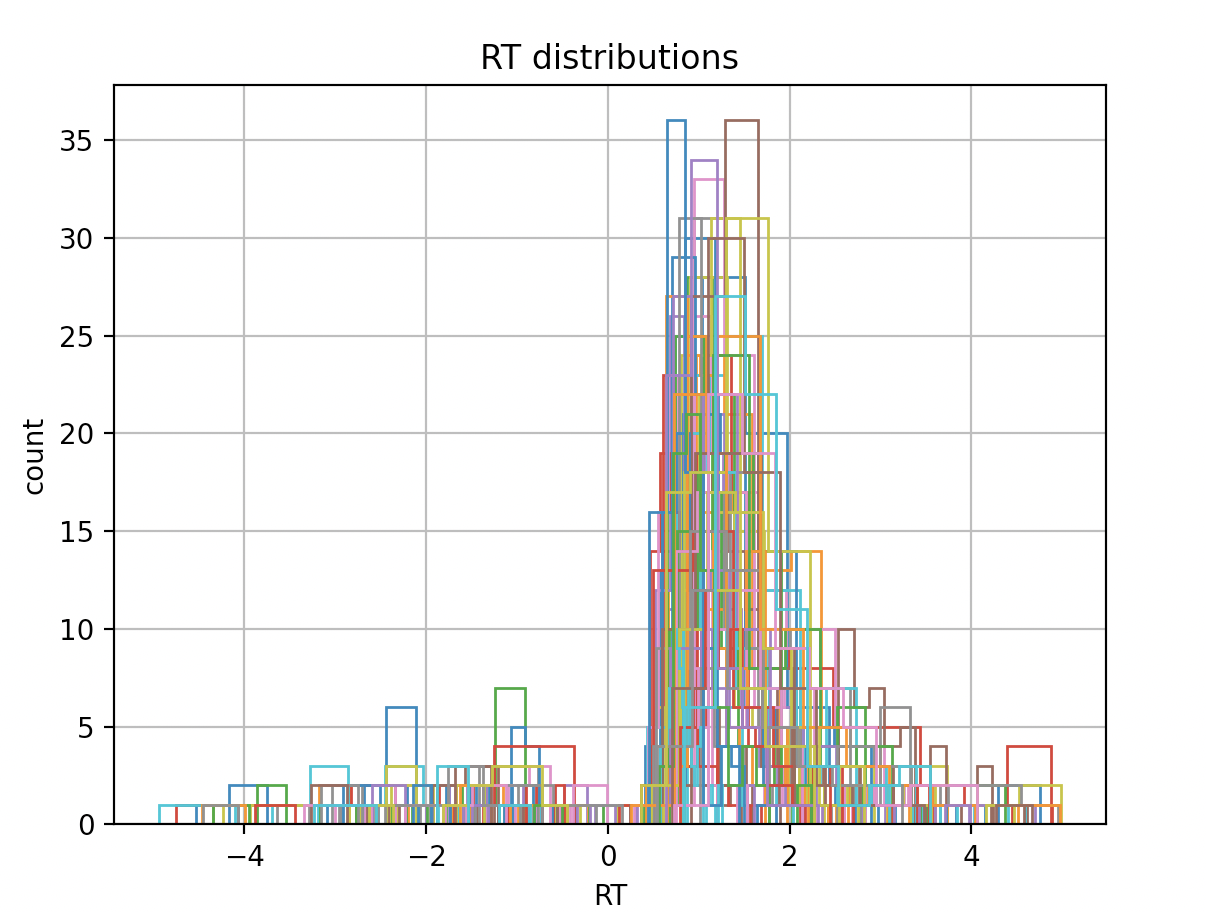
1. Number of participants and trials. I have 3 groups, 20, 21, 19 participants in each. The RT distribution for all subjects is shown below (the max number of trials is 82). Mostly the participants answer correctly, as shown below. Would this be an adequate number of trials to use hddm?
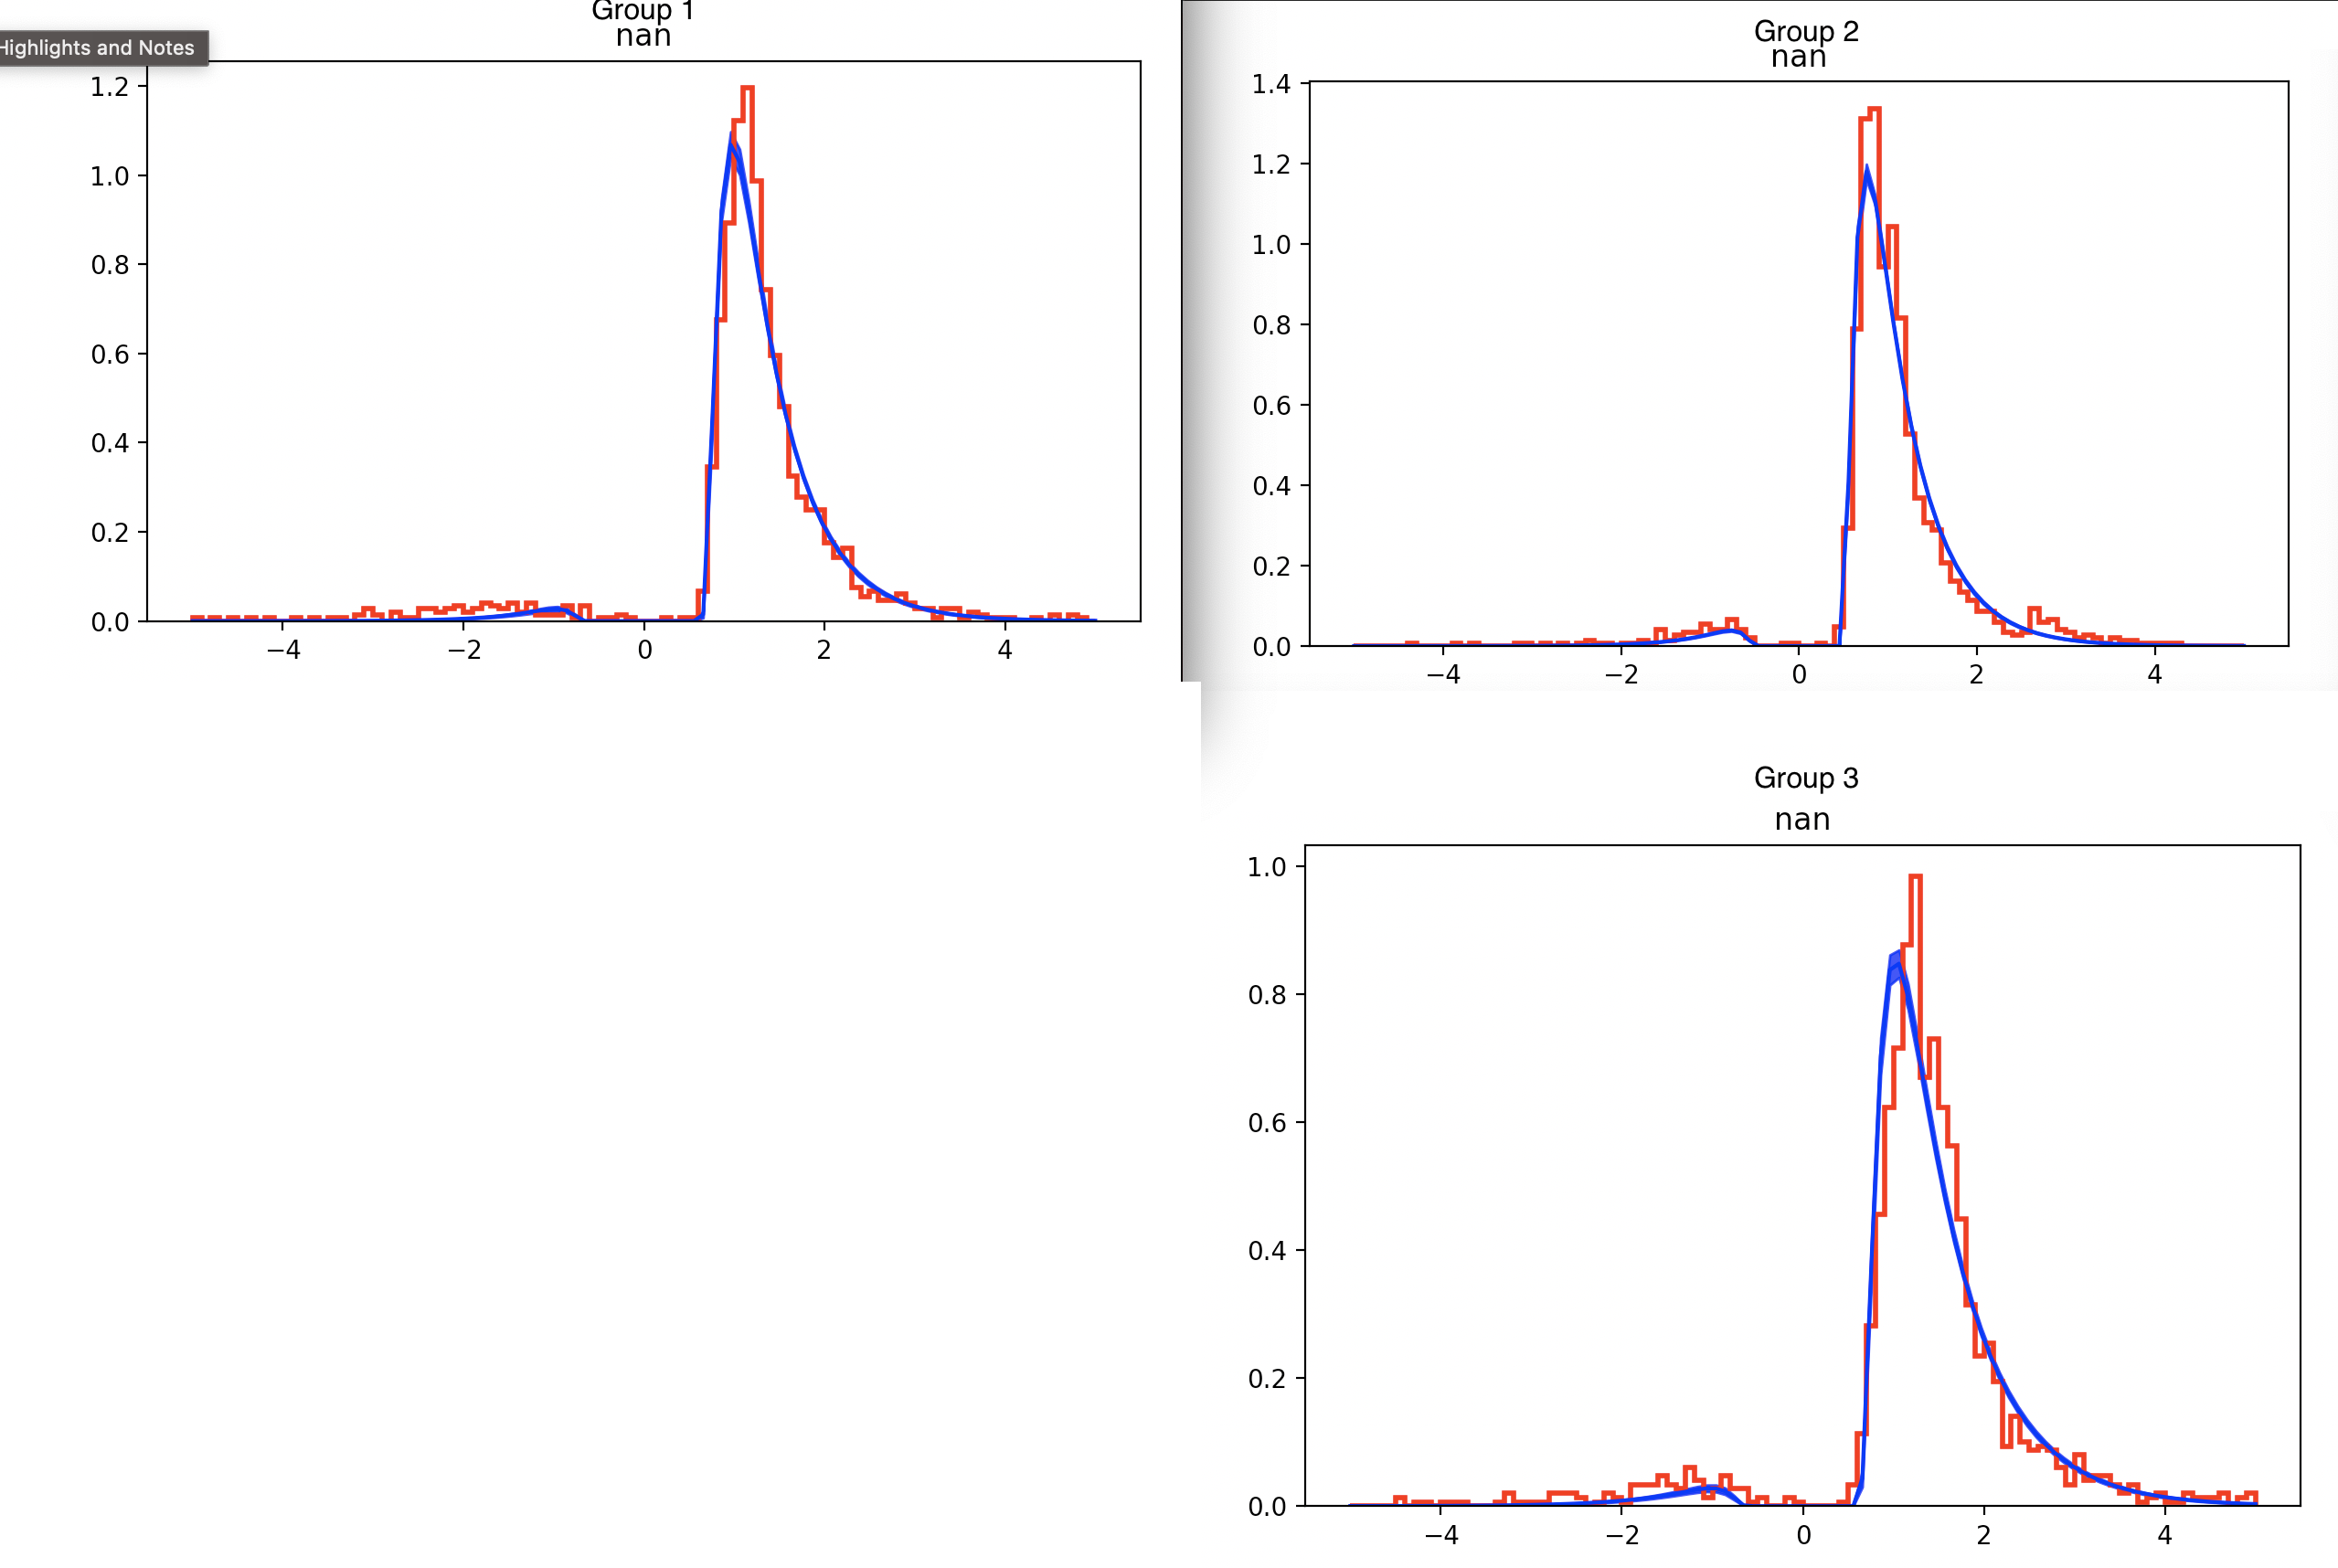
2. Model Fit. When running the model below, with samples=10000, burnin=2000, thin=1. I consistently get an underestimate of the data (I have tried adjusting the outlier to 0.05, 0.01, no outlier parameter). I have also tried the chi-square and gsquare optimizers, but the underestimation of the correct RT persists. Could you please advise on how to improve the fit?
mod_group = hddm.HDDM(data,
group_only_nodes=['v','a','t','sv'],
depends_on={'v':'sample', 'a':'sample', 't': 'sample'}, p_outlier=0.01)
Please note that sample is a grouping variable.
Thank you again for your time, and for creating and maintaining this community!
Kind Regards,
Zhamilya

Alexander Fengler
Jun 6, 2021, 10:30:18 PM6/6/21
to hddm-users
Hi Zhamilya,
in general you have a bunch of options to improve the model fit still, however it might also be the case that you can't do much better with a DDM than your current results.
Some adjustment you could make are:
1. You could still include the 'st', and 'sz' variables.
2. You could allow subject wise estimation for 'v', 'a', 't' ('st') instead of making them group only nodes.
3. You can switch between informative / non-informative priors.
Generally I wouldn't judge this to be a bad fit even at this point thought.
Best,
Alex
Zhamilya Gazman
Jun 25, 2021, 2:00:01 PM6/25/21
to hddm-users
Dear Alex,
Thank you very much for your guidance and your time! I will implement these adjustments. I had one more question about outliers. Is there a way to determine what could be considered an outlier for HDDM, in a similar way we use Cook's/DFBETAS?
Thank you,
Kind Regards,
Zhamilya

Noham Wolpe
Jun 27, 2021, 11:23:24 AM6/27/21
to hddm-users
Hi Zhamilya,
You can also allow the model to estimate p_outlier as a free parameter (include = 'p_outlier'). In addition to p_outlier, it is recommended to exclude ultra fast trials with RT<0.2 s for example.
There are some features in your RT data which will be difficult for a standard DDM to capture, e.g., the second mini-peak in Group 2 or the gradual increase in RT to the first peak.
Noham
Zhamilya Gazman
Jul 19, 2021, 2:57:40 AM7/19/21
to hddm-...@googlegroups.com
Dear Noham,
Thank you for your suggestions!
--
You received this message because you are subscribed to the Google Groups "hddm-users" group.
To unsubscribe from this group and stop receiving emails from it, send an email to hddm-users+...@googlegroups.com.
To view this discussion on the web visit https://groups.google.com/d/msgid/hddm-users/a9639663-2d84-4224-80fd-c22613cbdcb9n%40googlegroups.com.
Zhamilya Gazman
Jul 19, 2021, 2:11:30 PM7/19/21
to hddm-users
Dear All,
to get:
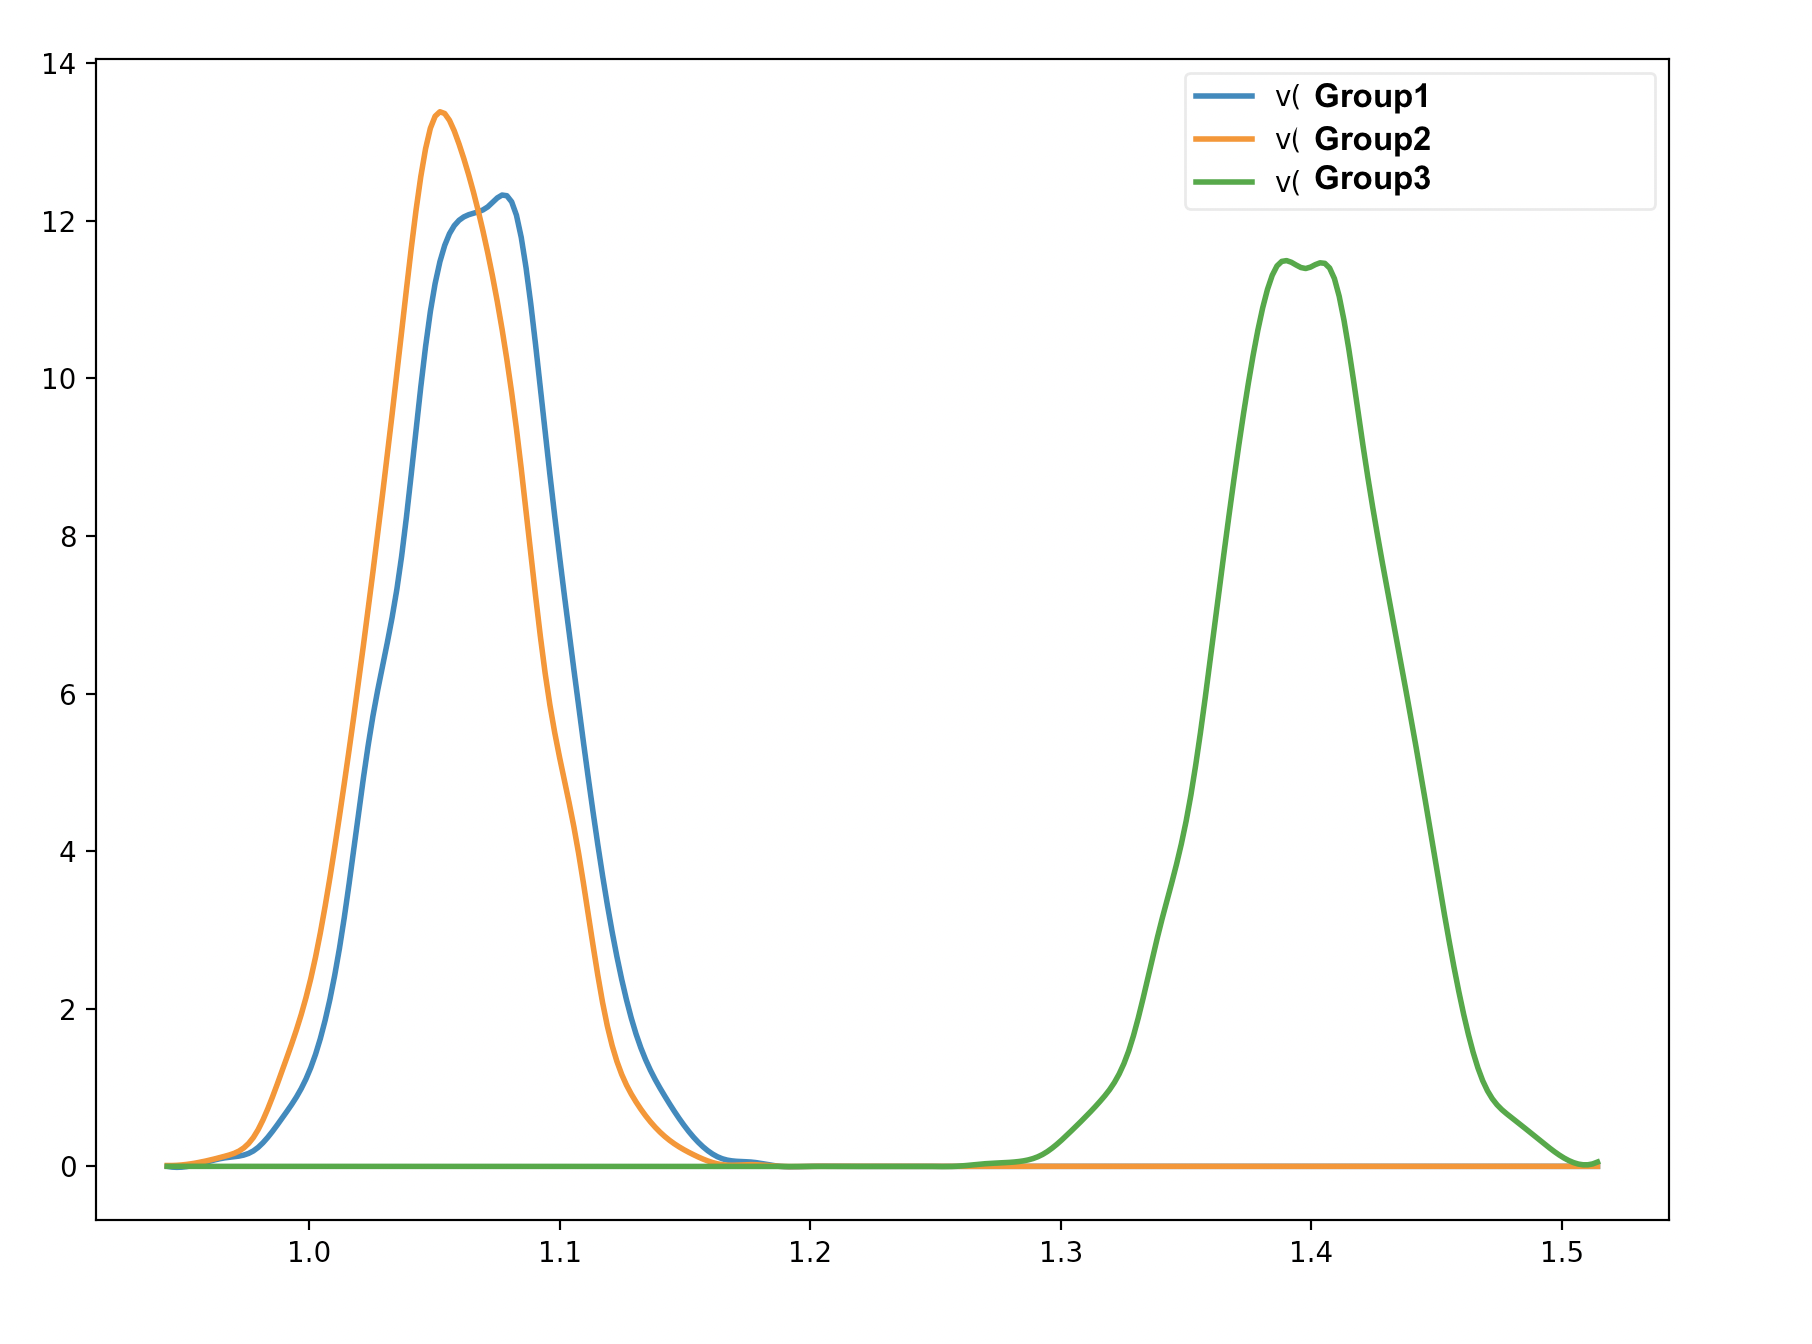
Hope all is well, and thank you for the previous suggestions. I have a question regarding the hypothesis testing. I have compared the posterior for these groups:
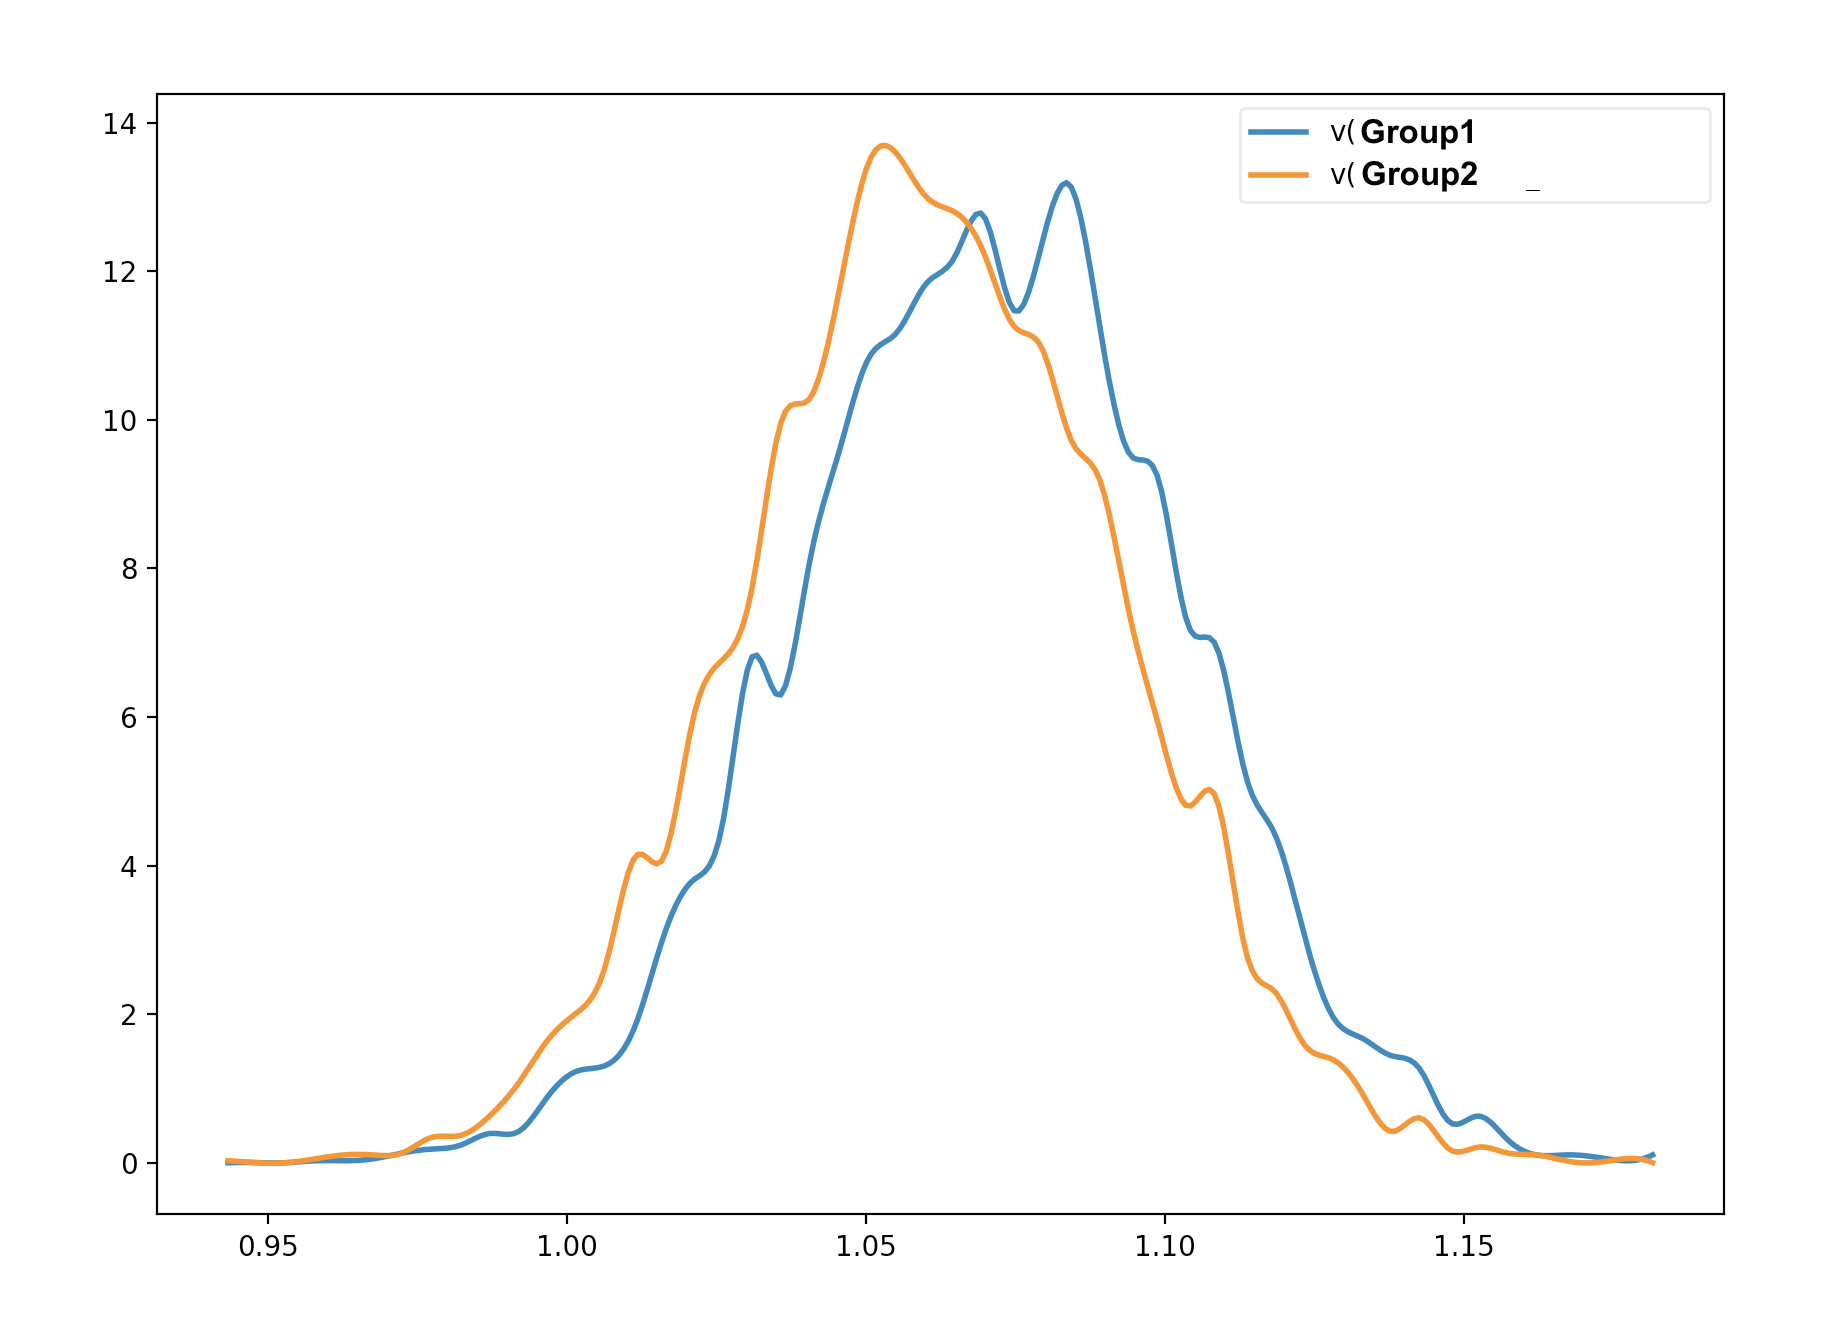
Group1, Group2 = mod_group.nodes_db.node[['v(Group1)', 'v(Group2)']]
print ((Group1.trace() >Group2.trace()).mean())
Group2, Group3 = mod_group.nodes_db.node[['v(Group2)', 'v(Group3)']]
print ( (Group3.trace()> Group2.trace()).mean())
Group1, Group3 = mod_group.nodes_db.node[['v(Group1)', 'v(Group3)']]
print ((Group3.trace()>Group1.trace()).mean())
to get:
1.0
0.99925
1.0
I understand why the probability of the second and third cases is 0.99925 and 1.0 (the probability that group 3 is larger than group 2, and the probability that group 3 is larger than group 1). However, from the graphical output, there seems to be an overlap between Group 1 and Group 2 (please see the image below). Am I interpreting the test incorrectly?
Thank you,
Kind Regards,
Zhamilya

Michael J Frank
Jul 19, 2021, 2:27:22 PM7/19/21
to hddm-...@googlegroups.com
Hi Zhamilya,
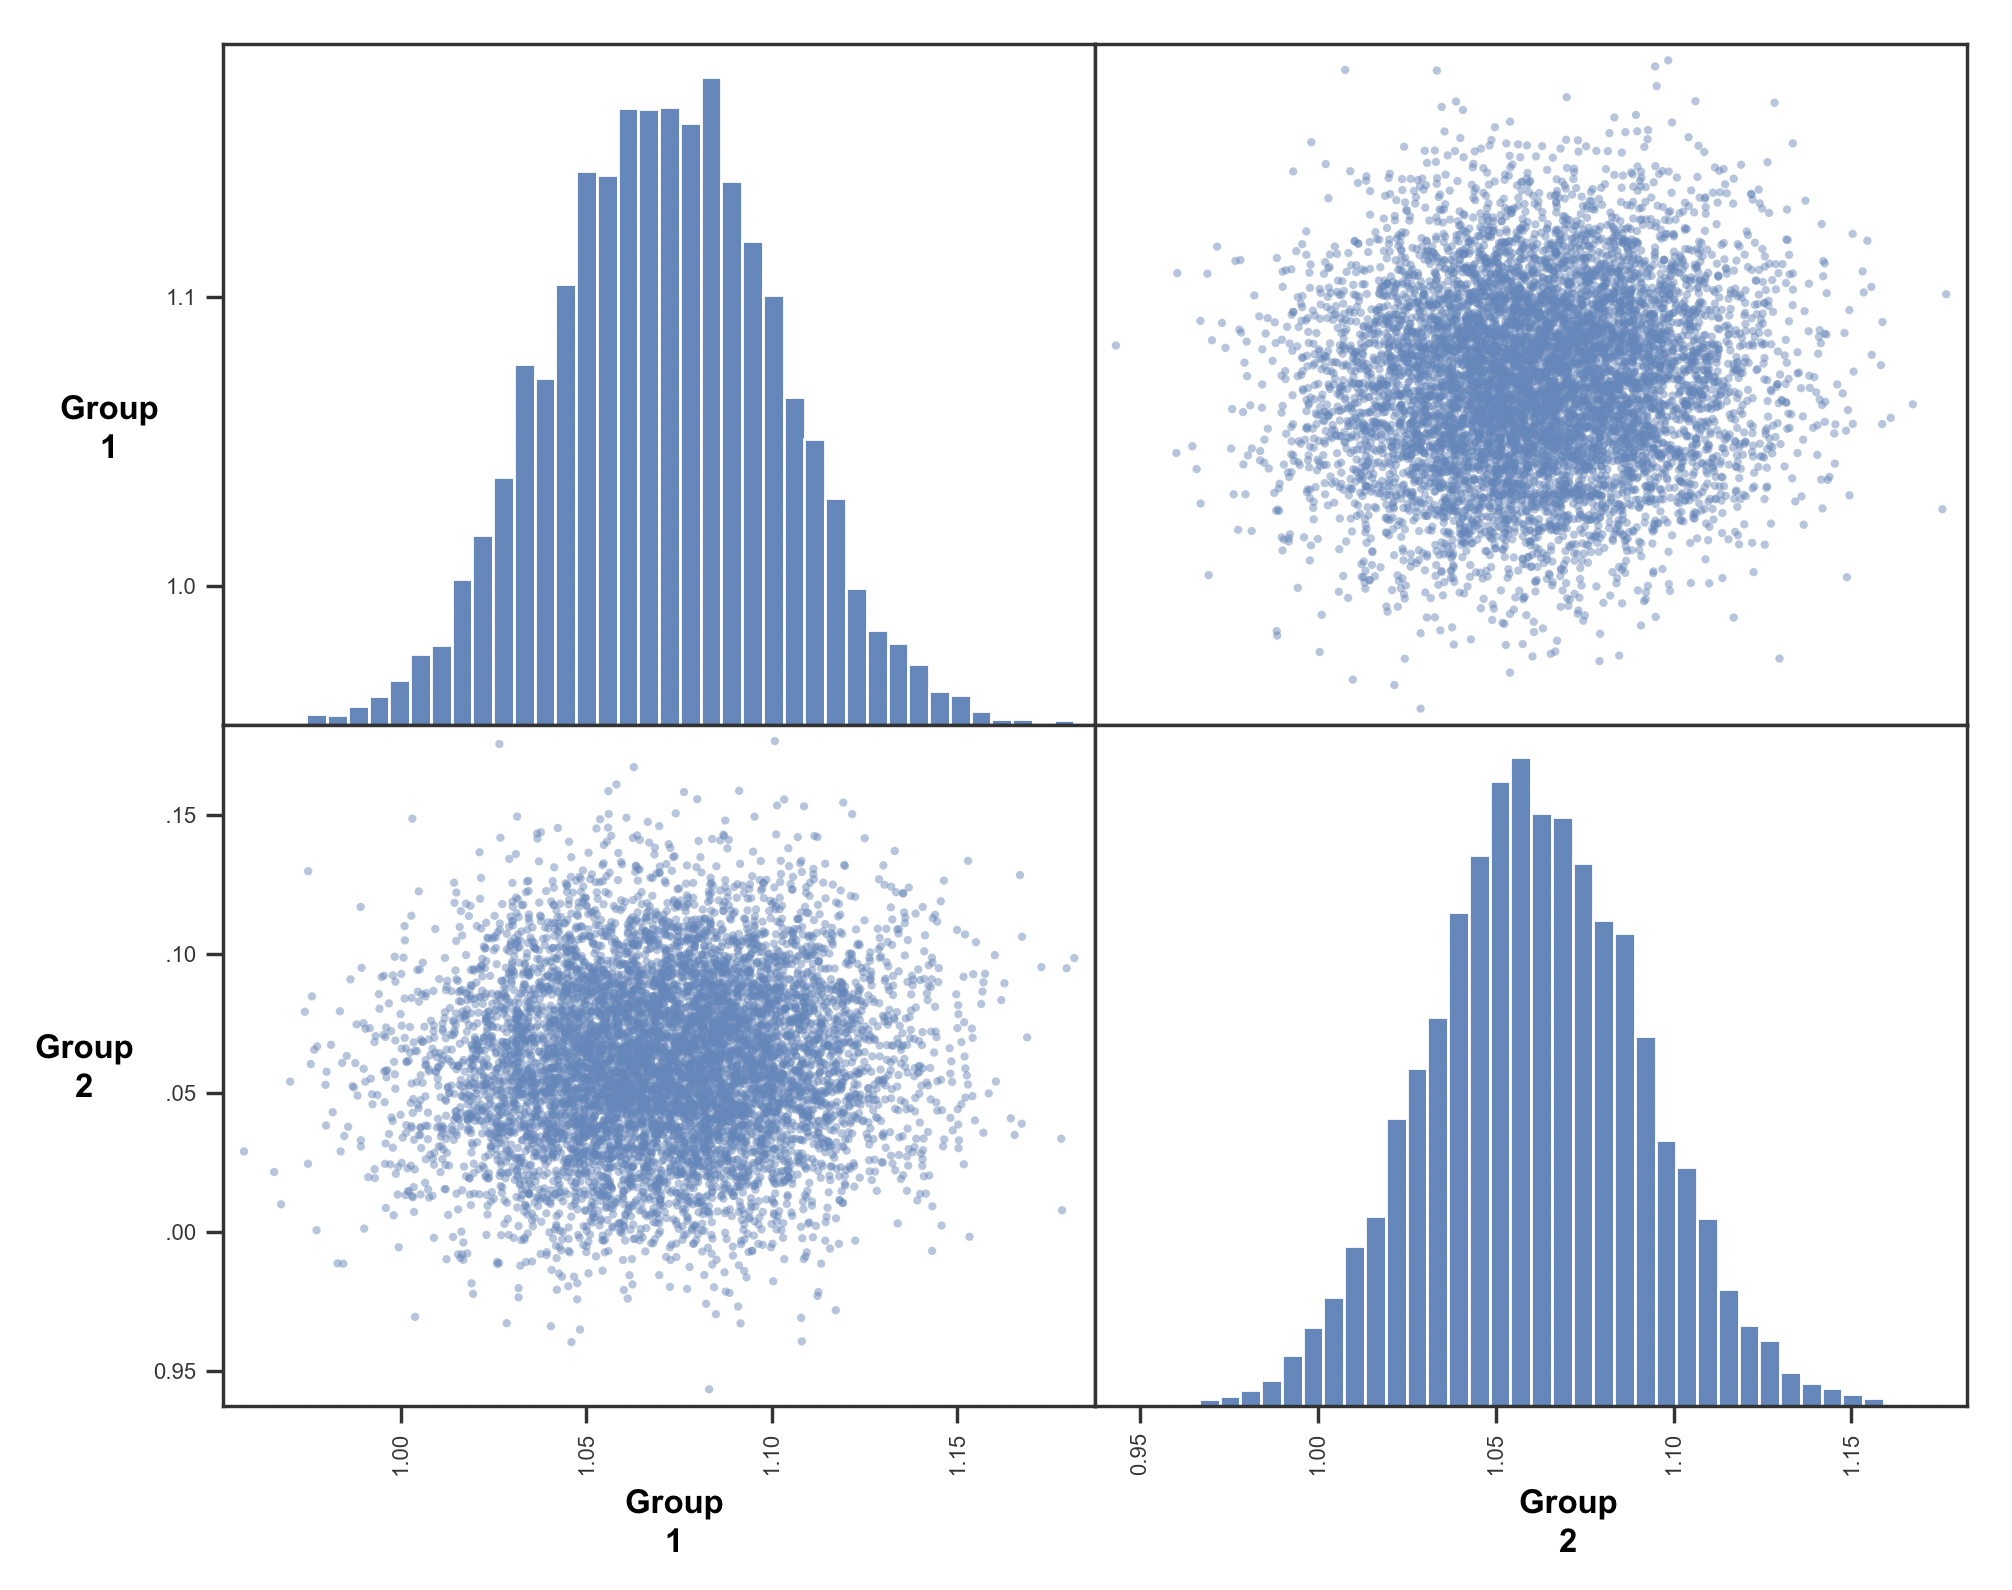
there can sometimes be overlap in the marginal distributions even when each sample is larger for one trace than another - ie the two posteriors are likely correlated with each other so that when one is sampled from the upper end the other is also, with a consistent difference. You could look at the joint distributions by plotting group 1 against group 2 samples to verify
--
You received this message because you are subscribed to the Google Groups "hddm-users" group.
To unsubscribe from this group and stop receiving emails from it, send an email to hddm-users+...@googlegroups.com.
To view this discussion on the web visit https://groups.google.com/d/msgid/hddm-users/ff13dbdc-c721-4160-b659-3b68569ff1aen%40googlegroups.com.
Michael J Frank
Jul 20, 2021, 1:40:16 PM7/20/21
to Zhamilya Gazman, hddm-...@googlegroups.com
Thanks Zhamilya,
Great, that makes sense. In theory it is possible that there could be a real difference between posteriors even if there is some overlap in the marginals, if there is a lot of parameter covariance (this is analogous to a within-subject effect that is reliable despite a lot of between subject variability). But in your case the correlations between the two traces would have had to be very high for that to be the case, given the amount of overlap.
cc'ing the user list just for others' interest in similar situations.
M
On Tue, Jul 20, 2021 at 1:30 PM Zhamilya Gazman <zhamily...@gmail.com> wrote:
Dear Dr. Frank,I have figured out my error- it was due to calling the incorrect posterior (from another group). When running the corrected code, the probability that Group 1 is larger than group 2 is 0.5955 (which is the overlap).

__________I have used the following code to generate the scatter plot:Group1_Atld, Group2_Atld = mod_group.nodes_db.node[['v(Group1.Atld)', 'v(Group2.Atld)']]
Group1_Atld= (Group1_Atld.trace())
Group2_Atld= (Group2_Atld.trace())
one_condition=pd.DataFrame(Group1_Atld, columns=['Group1'])
second_condition=pd.DataFrame(Group2_Atld, columns=['Group2'])
both_conditions = pd.concat([one_condition, second_condition],axis=1)
pd.plotting.scatter_matrix(both_conditions, hist_kwds={'bins':70})Thank you for showing me a new way to compare posterior plots - and for your guidance.Kind Regards,ZhamilyaOn Tue, Jul 20, 2021 at 7:38 AM Michael J Frank <Michae...@brown.edu> wrote:Hm, that's odd - if the difference between the traces is 1.0 that would imply that every sample for group 1 is higher than the corresponding one for group 2 (which one could see in the scatter plot) - but that is not the case, as they are mostly uncorrelated and overlapping. I suspect there is a bug somewhere - can you print the output of Group1.trace() and Group2.trace()? and show your code for how you generated those scatter plots?On Mon, Jul 19, 2021 at 9:51 PM Zhamilya Gazman <zhamily...@gmail.com> wrote:Dear Dr. Frank,Thank you for your email. I have plotted the traces from the previous email against each other (please see attached). However, I am not sure how to interpret it. Thank you very much for your time - I am new to HDDM/Bayesian analysis and really appreciate your help.Kind Regards,ZhamilyaOn Mon, Jul 19, 2021 at 3:14 PM Michael J Frank <Michae...@brown.edu> wrote:I mean not to plot the posteriors but to plot the samples from the traces for each group against the other - it would be a scatter plot with each value for group 1 on the x-axis and the value for group 2 on the y-axisOn Mon, Jul 19, 2021 at 3:10 PM Zhamilya Gazman <zhamily...@gmail.com> wrote:Dear Dr. Frank,Thank you for your guidance! I have plotted just the posteriors for the two groups. Is there another check that I can do beyond comparing the posteriors?
Group1, Group2 = mod_group.nodes_db.node[['v(Group1)', 'v(Group2)']]print ((Group1.trace() >Group2.trace()).mean())
1.0
Zhamilya Gazman
Oct 19, 2021, 11:57:56 AM10/19/21
to hddm-users
Dear All,
Hope all is well. I had an additional question regarding the unequal number of trials per subject (median number of trials = 77)?
I also wanted to see if there are any HDDM assumptions/checks that need to be taken into account (beyond the Gelman-Rubin’s R-hat statistic and the PPC checks)?
Thank you,
Kind Regards,
Zhamilya
Reply all
Reply to author
Forward
0 new messages