Model Fit Visuals vs DIC?
173 views
Skip to first unread message

Zhamilya Gazman
Jul 25, 2021, 11:11:27 PM7/25/21
to hddm-users
Dear all, 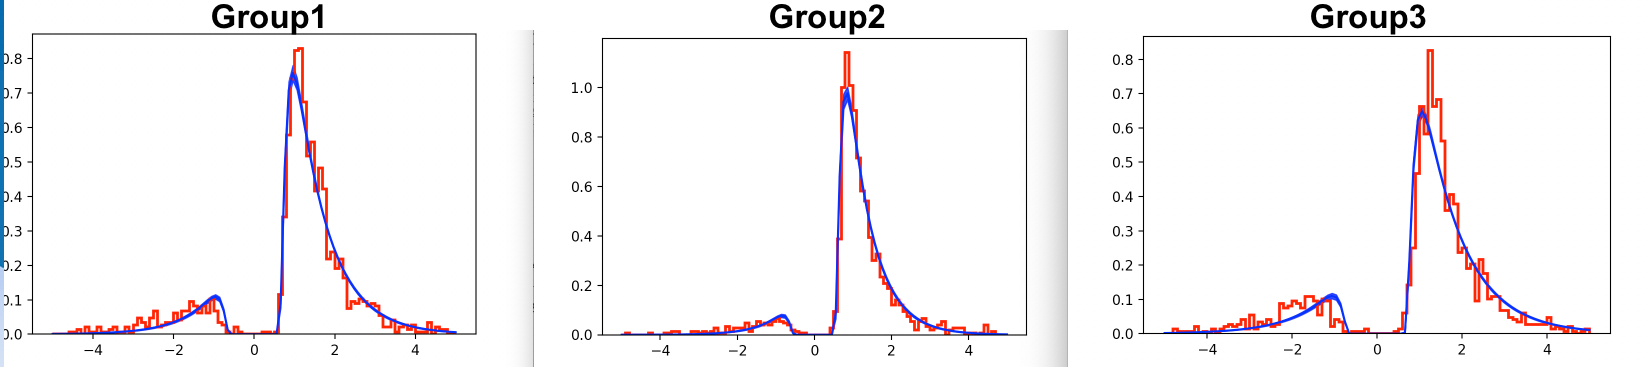
Hope all is well! I am comparing two models:
Model 1, In which v,a,t depend only on group. (data, group_only_nodes=['v','a','t'], depends_on={'v':['group'], 'a':['group'], t': 'group'}). DIC = 9912
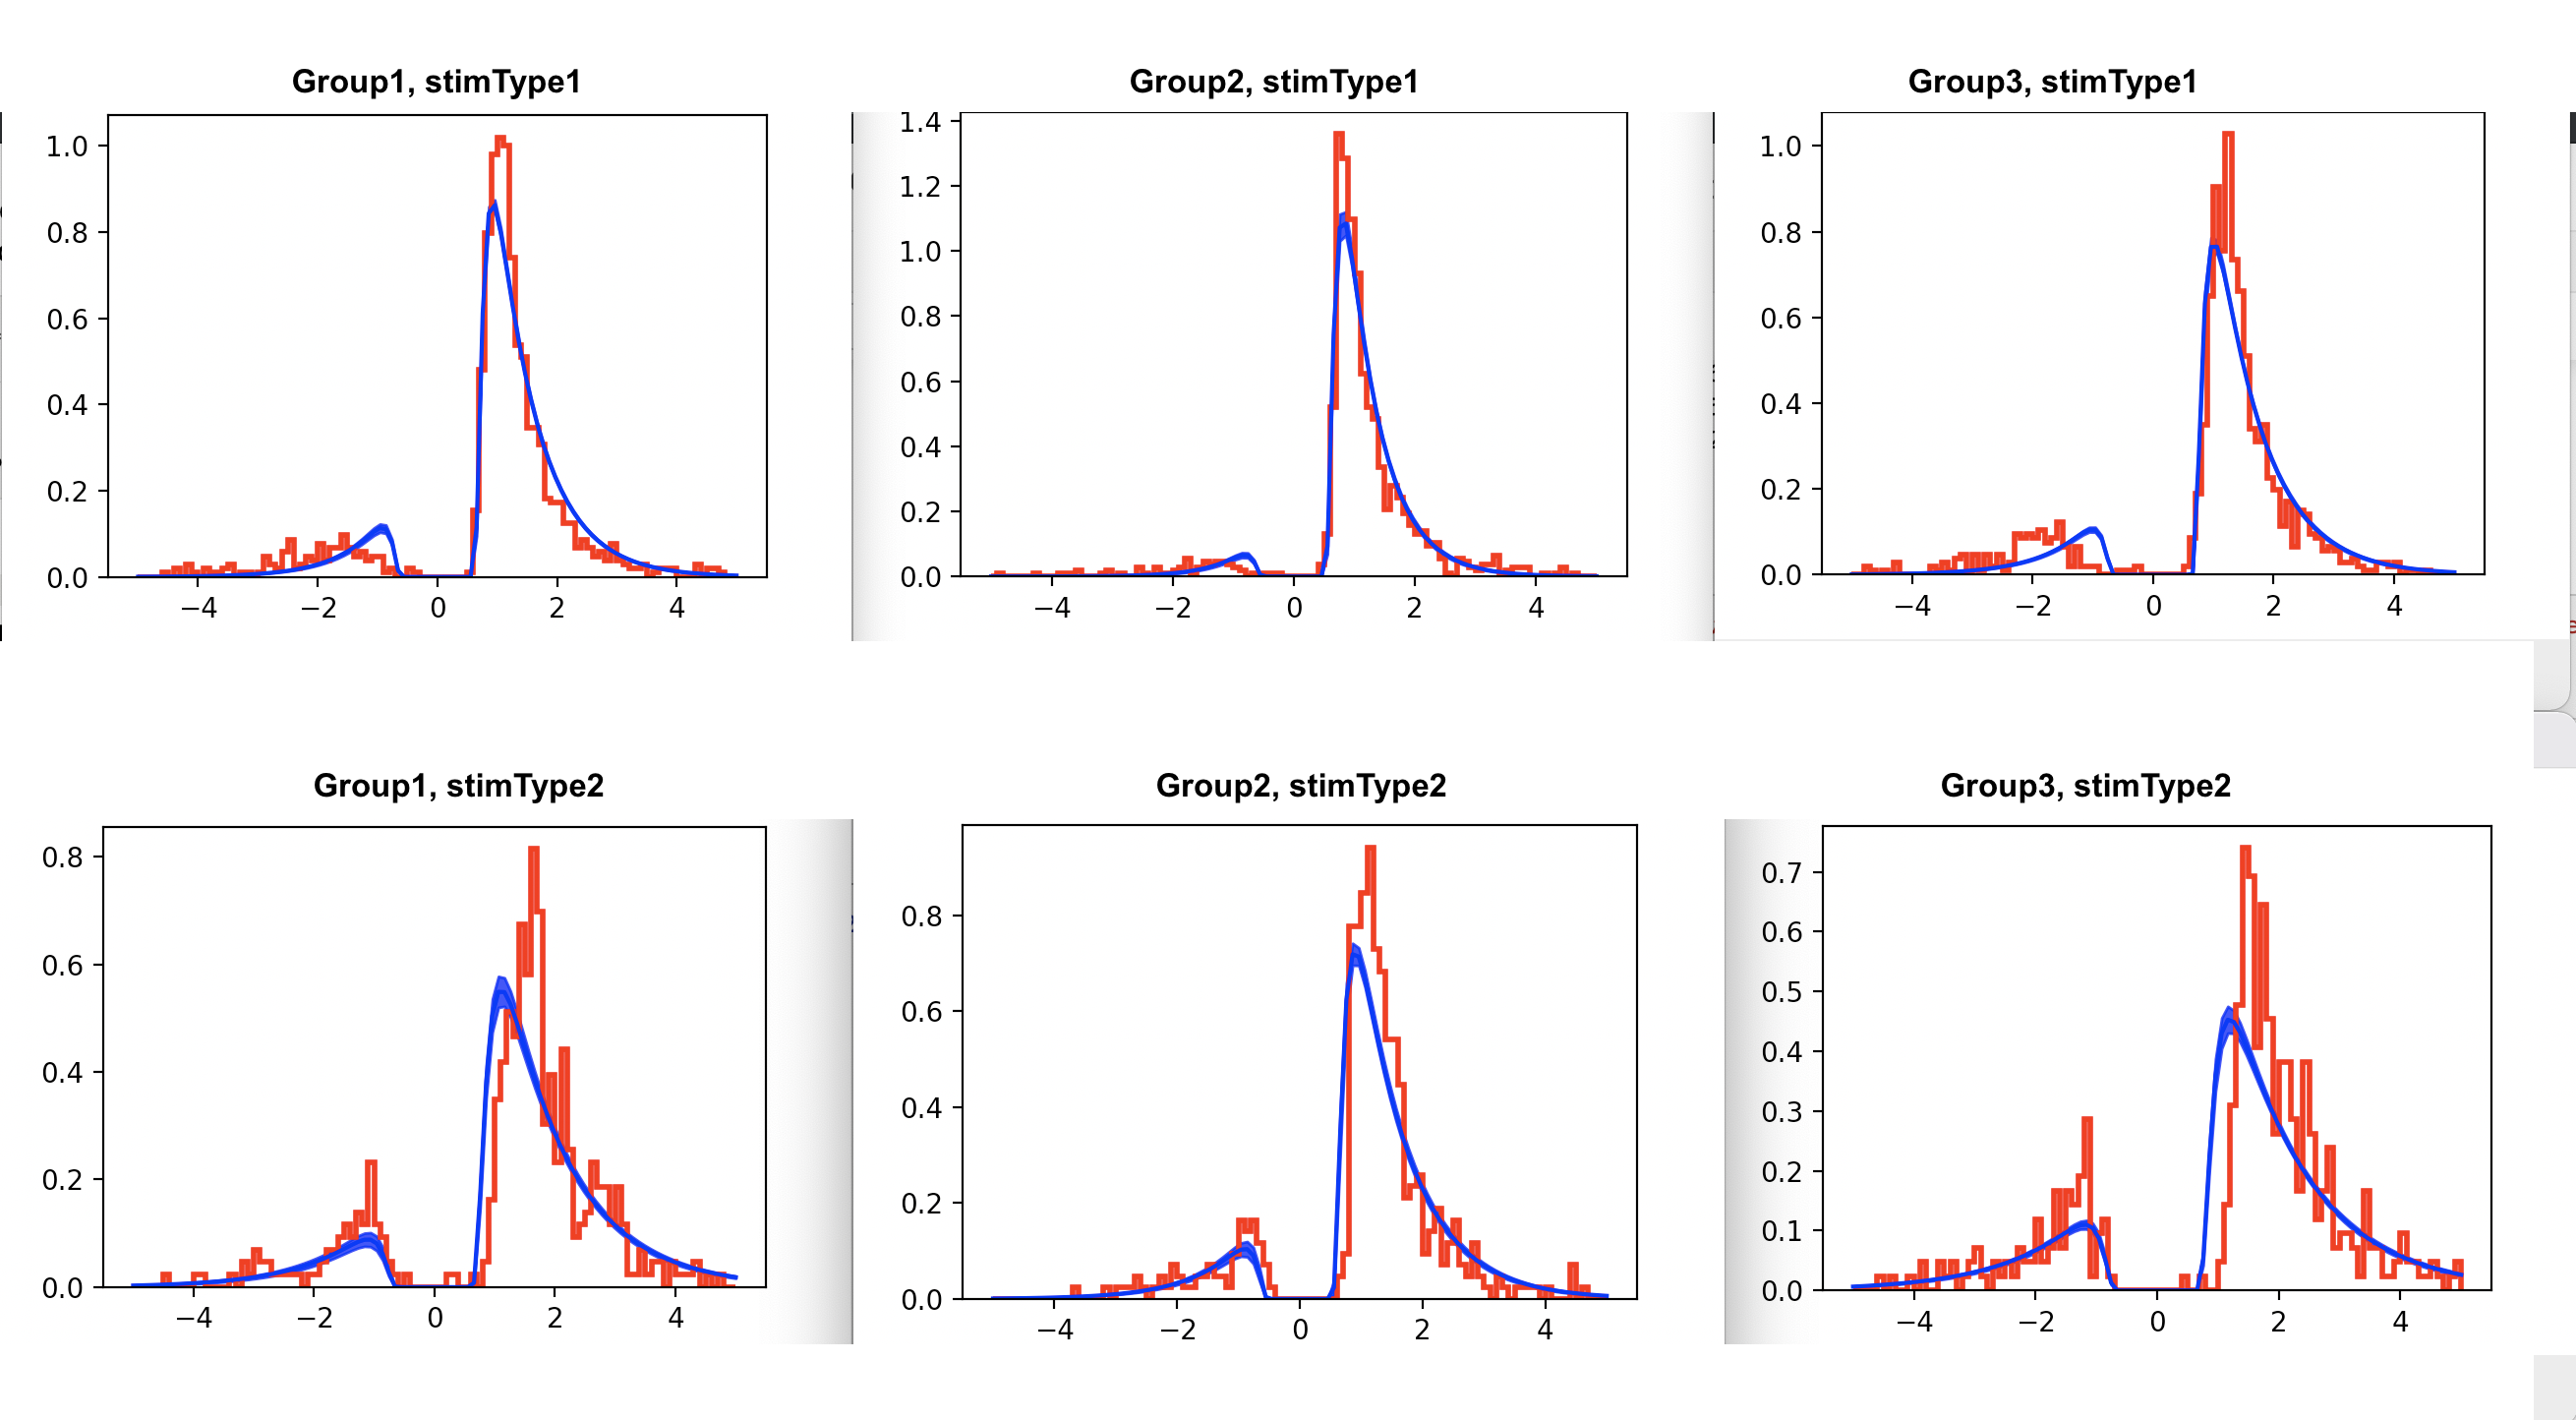
Model 2, In which v and a depend both the group and stimulus type. (data, group_only_nodes=['v','a','t'], depends_on={'v':['group','stimType'], 'a':['group','stimType'], t': 'group'}) DIC = 9728
For both models, the Gelman-Rubin statistic values were below <1.1. Even though the DIC is smaller for Model 2, when plotting the RT distributions on top of the likelihood, Model 1 appears to be a better fit. In this case, would we go with the visuals, and not the DIC?
Thank you in advance,
Z

Michael J Frank
Jul 27, 2021, 6:12:02 PM7/27/21
to hddm-...@googlegroups.com
Hi Zhamilya,
usually I would argue that model validation (including PPCs) are at least if not more important than any single model fit statistic like DIC. But in this case, the reason the model looks like it fits worse visually for model 2 seems like it is simply that there is less data when you divide it into 2 stimtypes (particularly the second row shows very jagged distributions which are generally what one would expect with low trial counts - even if the true generative distribution is smooth).
So if you want to compare the visuals between the two models you should instead replot model 1 but separated into two stimtypes. The model data will be the same for both rows (because you only estimate it across both stimtypes) but the actual data will be different, just like it is in the bottom plot. And from a quick skim it does look like the data are a little different, eg more errors and more variable distributions for stimtype 2, which model2 somewhat captures.
--
You received this message because you are subscribed to the Google Groups "hddm-users" group.
To unsubscribe from this group and stop receiving emails from it, send an email to hddm-users+...@googlegroups.com.
To view this discussion on the web visit https://groups.google.com/d/msgid/hddm-users/36f0cbc9-2cc1-4a10-91f3-10862beb0145n%40googlegroups.com.
Zhamilya Gazman
Jul 30, 2021, 3:58:04 PM7/30/21
to hddm-users
Dear Dr. Frank,
Thank you very much for your time,
My apologies for the delay, hope all is well. Thank you for your suggestions.
PCC
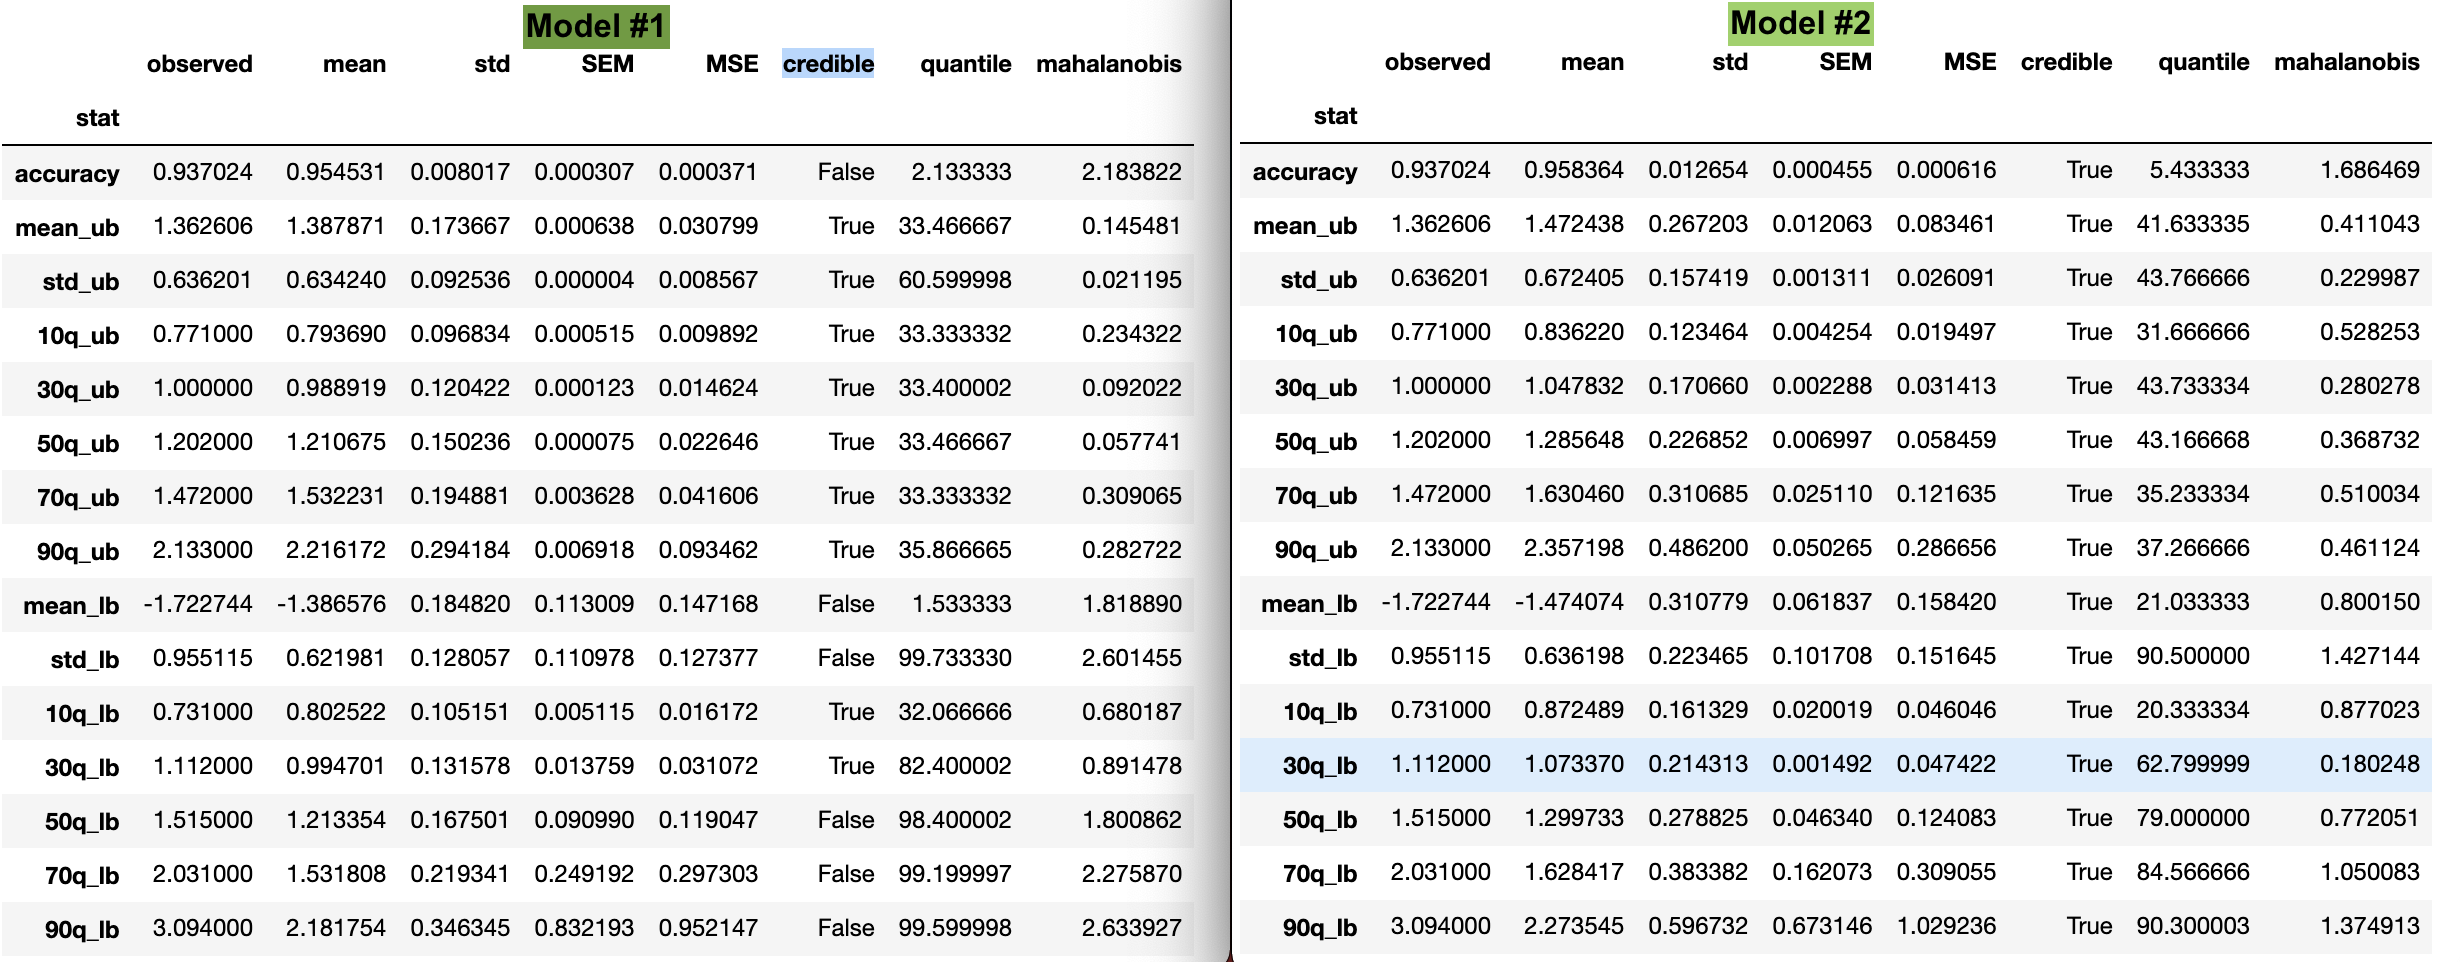
I have compared the raw data and model data using the post_pred_stats(). It looks like the summary statistics for model 2 (which has the lower DIC) are all in a credible range, compared to model 1. Would we select model 2, based on this check?
Plotting Model 1
I have plotted the raw data for model 1 but unfortunately was not able to extract the data from plot_posterior_predictives(). Is there a way to extract the data to overlay it over the original data?
(Code used to plot the raw data):
for i, subj_data in baseline_data.groupby(['group','stimType']):
ax = fig.add_subplot(111, xlabel='RT', ylabel='count', title='RT distributions')
subj_data.rt.hist(bins=20, histtype='step', ax=ax)
fig=plt.figure()
Thank you very much for your time,
Kind Regards,
Zhamilya
Message has been deleted
Zhamilya Gazman
Aug 18, 2021, 1:54:28 PM8/18/21
to hddm-users
Dear all,
Thank you for your advice. I have another question in terms of hypothesis testing, being new to the Bayesian framework. I understand that if the probability of one posterior distribution is greater than the second by at least 95%, then we can conclude that they are different.
1. How can I extract the 95% HDI from a given parameter trace?
2. The ROPE could be interpreted in terms of Bayes Factor. Could we then interpret the difference between two posteriors as "decisive, strong" etc?
Thank you very much,
Kind Regards,
Zhamilya

hcp...@gmail.com
Aug 18, 2021, 9:41:19 PM8/18/21
to hddm-users
Hi, Zhamilya,
1. How can I extract the 95% HDI from a given parameter trace?
You can first use `m.get_traces()` to get the traces of all parameters. please see http://ski.clps.brown.edu/hddm_docs/manual.html.
After getting the traces, you have many options to get the 95% HDI. Here is a link for different answers: https://stackoverflow.com/questions/22284502/highest-posterior-density-region-and-central-credible-region
PS: I am trying to convert the HDDM object into InferenceData of arviz (https://groups.google.com/g/hddm-users/c/cO9EBdRAvzs), after getting the InferenceData, we can use arviz's `hdi` function directly. However, the code is not perfect and I haven't add enough comments for others to fully understand the script. But if you are familar with python, I think you can re-use my code (https://github.com/hcp4715/hddm_docker/blob/master/example/HDDM_official_tutorial_ArviZ_nan_issue_waic.ipynb) and only include the observed data and posterior traces into InferenceData and use arviz.hdi to get the 95%HDI. Otherwise, I recommend you use the two-step approach.
2. The ROPE could be interpreted in terms of Bayes Factor. Could we
then interpret the difference between two posteriors as "decisive,
strong" etc?
If I understood it correctly, ROPE and Bayes factor are two different approaches for inference. Combing ROPE and HDI, you can only have three states: accept null value, reject null value, or undecided. Please see this paper: https://journals.sagepub.com/doi/full/10.1177/2515245918771304
Hope it helps
Best,
Chuan-Peng
Zhamilya Gazman
Aug 20, 2021, 10:46:20 AM8/20/21
to hddm-users
Dear Chuan-Peng,
Thank you very much for your suggestion and for sharing your code, I will test it.
I wanted to see if we could also interpret the model output in terms of BF, since I have seen some papers comparing the two methods
(Linde et al. (2020) - https://psyarxiv.com/bh8vu). I also wanted to see, if the value from comparing the two posterior distributions is close to 95% (94.73%), in this case, would we reject?
I appreciate your time and expertise,
Kind Regards,
Zhamilya
hcp...@gmail.com
Aug 27, 2021, 10:52:16 PM8/27/21
to hddm-users
Hi, Zhamilya,
Calculating BF is a great idea, but I haven't seen how to do it in the case of HDDM.
I also wanted to see, if the value from comparing the two posterior
distributions is close to 95% (94.73%), in this case, would we reject?
If I remembered it correctly, comparing two posterior distributions directly (what you get is called Bayesian p-value) is debated. Maybe you can treat the 95% HDI of one posterior as the ROPE, and compare it with the 95%HDI of the second posterior distribution, you can then used the same approach as proposed in this paper: https://journals.sagepub.com/doi/full/10.1177/2515245918771304
As for 95% vs. 94.73%, I think 95% is an arbitrary criterion, it should not be so rigid. Ultimately, it depends on you (and other people in the field) to interpret the results and make inference.
Best,
Chuan-Peng
Reply all
Reply to author
Forward
0 new messages