MapStore not loading all entries on 'loadAll()'
82 views
Skip to first unread message

Joan Balagueró
Nov 25, 2021, 5:14:25 PM11/25/21
to Hazelcast
Hi,
return new StatementIterable<>(this.allKeysStatement);
}
Hazelcast 4.2.
I currently have 6 entries on our database, all are active (non expired). But mapStore.loadAll is only loading 4 entries. In fact if our database table contains N non-expired entries, hz always load N-2 entries.
Our loadAll() is as follows:
public Iterable<String> loadAllKeys() {return new StatementIterable<>(this.allKeysStatement);
}
Where this.allKeysStatement is:
this.allKeysStatement = conn.prepareStatement("SELECT TOKEN_ID FROM AUTH_TOKEN_STORE WHERE API_ID = " + apiId);
In this test we are always using the same apiId. The 'StatementIterable' and 'ResultSetIterator are the ones used on the hz samples.
These are the 4 keys loaded (printed on the 'next()' method):
key = NXaQtna3f7YSWZYxImVDoGlUjx03OvP44EpwZVis5e2T9LN1YFhhNtHIUvF57DTrci5yEdGx2mA=
key = FKqX6OvIG3MLsZaVYIyumNsX7yHZUm7dakWt69miBFo0X7xiDU+w2bglFpmYfPdkwY+VrjCOJB8=
key = NkA2qa7bC6llzDtd1qhXwpSazuAae3C+hf3CpKEOKfKtUzBDqM4k4kH0MdMTKIVccvCA6mOb7xk=
key = FMa/abv5b8Gd1+a9ExMU/Nmsld+GboN84KS2ZHj9eSmN8cXzEmWmX9VV+BbcjPF/bv0MJkkV9wI=
The image attached contains the 6 available keys.
Any idea?
Thanks,
Joan.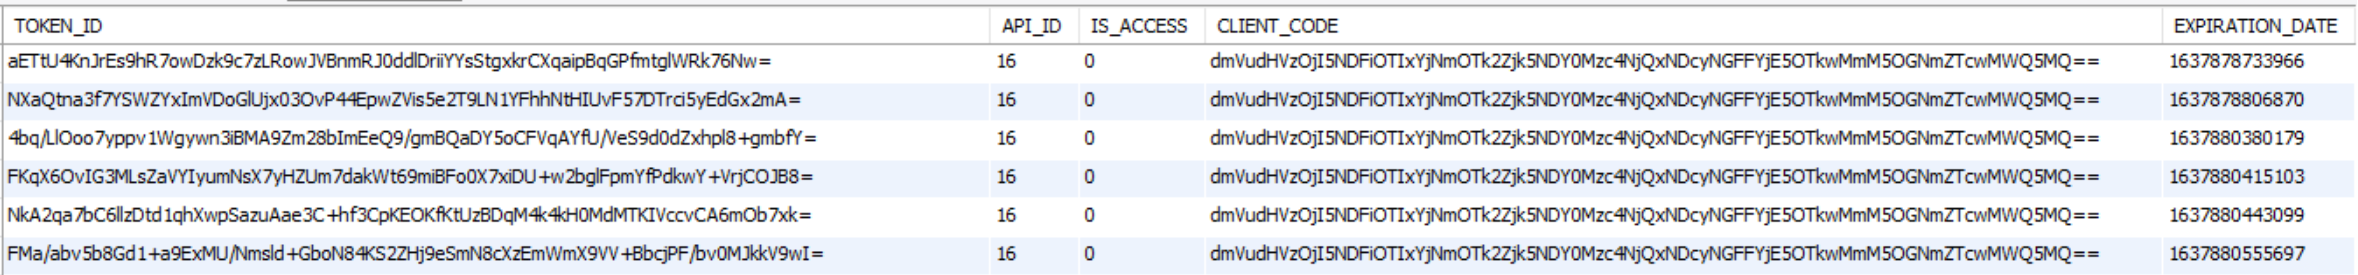

Neil Stevenson
Nov 26, 2021, 2:57:02 AM11/26/21
to Hazelcast
Hi,
There's three ways to help diagnose further
(1) Can you add logging to "loadAllKeys()" to confirm the number requested to be loaded (would expect 6 or 4).
This collection is then spread across multiple "loadAll(Collection<K>)" to load the full row, so:
(2) Can you add logging to "loadAll()" to show if any rows it tries to load aren't loaded
because it could be some of the primary keys it tries to load somehow fail
(3) finally, can you check if eviction/expiry is configured. It could be rows are loaded but then immediately deleted because of space constraints.
Neil
Joan Balagueró
Nov 26, 2021, 7:18:25 AM11/26/21
to Hazelcast
Hi,
Now we have 4 keys on the database table. If I stop and start my app :
1. the 'loadAll()' log tells:
loadAll({1}) got only {1}
loadAll({1}) got only {1}
2. The keys printed on the ResultSetIterator.next() method are:
key = uGzwxuOEi/SS3ddLUHlDCGHxQ35aT3cjevB3obIbDjyg3HTt6AV3KYYydJesAjklHSgR+bhMrPE=
key = sYrhLGfEus0bHm8mXl7ZrLo5SkkQz91e+3mIm7QHDaD18Ai/vGSrr/0fWAQ/607SDfoAd242tNs=
The 4 keys on the db table are:
FIrf21+9zD2bcL8hPkT1UjS5zn7un90mqjAjUrbZGsK2W6EibAAeoO64uYm9o/2nNLmrSkx5A2o=
ycKwNrKjuIE89CMwINH19A+QHjjJbZKJ7WpTAUhuCp4+IbW2mD1JiSeOSddR3XDM9onyQdvcd2A=
uGzwxuOEi/SS3ddLUHlDCGHxQ35aT3cjevB3obIbDjyg3HTt6AV3KYYydJesAjklHSgR+bhMrPE=
sYrhLGfEus0bHm8mXl7ZrLo5SkkQz91e+3mIm7QHDaD18Ai/vGSrr/0fWAQ/607SDfoAd242tNs=
The map does not have size restrictions, and the cache time for entries is 1h. This test just took a couple of minutes.
3. I don't know how to log on 'loadAllKeys()', my method is:
public Iterable<String> loadAllKeys() {
return new StatementIterable<>(this.allKeysStatement);
}
return new StatementIterable<>(this.allKeysStatement);
}
I suppose it's enough logging on the ResultSetIterator.next() method.
One more comment: we are performing these tests in a single node installation, and just one map of our app has this map store. If I take a look at the map entries I can see these 2 entries printed above on point 2.
Ok, now I change my loadAllKeys() method in this way:
public Iterable<String> loadAllKeys() {
try {
List<String> results = new ArrayList<>();
System.out.println("loadAllKeys(allKeysStatement) -> " +this.allKeysStatement);
ResultSet rs = this.allKeysStatement.executeQuery();
while (rs.next()) {
results.add(rs.getString("TOKEN_ID"));
System.out.println("loadAllKeys("+this.apiId+") :: key -> {"+rs.getString("TOKEN_ID")+"}");
}
System.out.println("loadAllKeys("+this.apiId+") -> {"+results.size()+"}");
return results;
} catch (Exception e) {
e.printStackTrace();
return null;
}
}
This is the 'loadAllKeys' trace (and loadAll):
loadAllKeys(allKeysStatement) -> sql : 'SELECT TOKEN_ID FROM AUTH_TOKEN_STORE WHERE API_ID = 16', parameters : []
loadAllKeys(16) :: key -> {FIrf21+9zD2bcL8hPkT1UjS5zn7un90mqjAjUrbZGsK2W6EibAAeoO64uYm9o/2nNLmrSkx5A2o=}
loadAllKeys(16) :: key -> {ycKwNrKjuIE89CMwINH19A+QHjjJbZKJ7WpTAUhuCp4+IbW2mD1JiSeOSddR3XDM9onyQdvcd2A=}
loadAllKeys(16) :: key -> {uGzwxuOEi/SS3ddLUHlDCGHxQ35aT3cjevB3obIbDjyg3HTt6AV3KYYydJesAjklHSgR+bhMrPE=}
loadAllKeys(16) :: key -> {sYrhLGfEus0bHm8mXl7ZrLo5SkkQz91e+3mIm7QHDaD18Ai/vGSrr/0fWAQ/607SDfoAd242tNs=}
loadAllKeys(16) -> {4}
loadAll({1}) got only {1}
loadAll({1}) got only {1}
loadAll({1}) got only {1}
loadAll({1}) got only {1}
It works.
Thanks,
Joan.
Neil Stevenson
Nov 26, 2021, 12:12:56 PM11/26/21
to Hazelcast
"loadAllKeys()" only runs on one node regardless of the cluster size. The returned keys are split per partition and sent to the "loadAll(Collection<K>)" methods on the members. Each member will probably have more than one collection to load.
Sounds like it could be an issue with how "new StatementIterable<>(this.allKeysStatement);" works as it doesn't give you the same answer as "this.allKeysStatement.executeQuery();"
It would be useful to find out why, but if it turns out to be impossible to diagnose at least you have a workaround
Neil
Joan Balagueró
Nov 30, 2021, 5:54:34 AM11/30/21
to Hazelcast
Hello Neil,
Ok, using my own result set works. Thanks.
Just one more question: when loadAllKeys is executed and the keys belonging to a member are received, I expected chunks of keys (I think the default chunk is 1000). But I receive the keys one by one on the 'loadAll' method.
In my case we have 4 keys on our database. When I start the application the log shows:
2021-11-30 11:32:30 [Token] Publishing 1 tokens on this node ...
2021-11-30 11:32:30 [Token] 1 tokens published on this node in 5 milliseconds.
2021-11-30 11:32:30 [Token] Publishing 1 tokens on this node ...
2021-11-30 11:32:30 [Token] 1 tokens published on this node in 4 milliseconds.
2021-11-30 11:32:30 [Token] Publishing 1 tokens on this node ...
2021-11-30 11:32:30 [Token] 1 tokens published on this node in 1 milliseconds.
2021-11-30 11:32:30 [Token] Publishing 1 tokens on this node ...
2021-11-30 11:32:30 [Token] 1 tokens published on this node in 1 milliseconds.
If the chunk size is 1000, should not I receive just one call to LoadAll() with a collection with the 4 keys? I'm working with just one node.
@Override
public synchronized Map<String, MetadataAwareValue<TokenValue>> loadAll(Collection<String> keys) {
long start = System.currentTimeMillis();
GlobalData.getInstance().getLoggerService().doInternalLogLookup("log.internal.token.publish.start", new Object[] { keys.size() });
Map<String, MetadataAwareValue<TokenValue>> result = new HashMap<>();
for (String key: keys) result.put(key, this.load(key));
GlobalData.getInstance().getLoggerService().doInternalLogLookup("log.internal.token.publish.end", new Object[] { keys.size(), System.currentTimeMillis() - start });
return result;
}
Thanks.
Joan.
Neil Stevenson
Nov 30, 2021, 9:19:56 AM11/30/21
to Hazelcast
Hi
Hazelcast is designed to work with huge volumes of data and multiple nodes. At smaller volumes, 1 node with 4 entries, it can be less obvious what is going on.
"loadAllKeys()" is called on 1 node in the cluster, regardless of the cluster.
The collection returned is split first by partition count (default 271) and then by "hazelcast.map.load.chunk.size" system property.
What is likely happening is your 4 keys belong in 4 different partitions, so the first split negates the need for the second.
Hazelcast uses partitioning to shard the map storage. Each node in the cluster looks after a share of the shards.
What happens here is that "loadAllKeys()" runs on 1 node in the cluster. You have only 1 node anyway.
The collection is returns is then split into one collection per shard, and these collections are sent to the nodes that own these collections.
So the main loading is split across all nodes in the cluster and happens in parallel. /*This makes loading faster so long as the RDBMS can cope with this parallel query load.*/
You have only 1 node, so this part is not obvious, but your logging may show different thread names being used.
If the collection for any one partition is larger than the chunk size, it is done in batches, to ease the pressure on the RDBMS.
You can confirm this in a few ways
(1) use "hazelcastInstance.getPartitionService().getPartition(K)" to find which partitions your entries would be stored in.
Partitions are managed by separate threads, depending on the CPUs, so if the data spreads across multiple threads the access rate can go up.
(2) try a 2 node cluster, or more nodes. "loadAllKeys()" will still run on one node, but "loadAll(Collection<K>)" will run in parallel across all nodes.
(3) for your existing set-up, for one test, set "hazelcast.partition.count" system property to "1". All keys will be in the same partition, as there's
only 1. And you'll see a batch of 4 passed to "loadAll(Collection<K)". Don't forget to remove that property after!
Neil
Reply all
Reply to author
Forward
0 new messages