Problems debugging in IntelliJ
203 views
Skip to first unread message

Sean McIlvenna
May 17, 2021, 9:45:37 PM5/17/21
to HAPI FHIR
I'm debugging `hapi-fhir-jpaserver-starter`. I recently switched to the `rel_5_4_0` branch. I re-ran `mvn install` before starting the debugger (as a matter of habbit). When I encounter an exception, the stack trace shows the file and line number (as you would expect). However, when I click on the file/line, it brings me to the wrong location in the file. In other words, the debugging assemblies don't seem to match the runtime assemblies. Granted, it's using decompiled .class files from the core hapi-fhir project where the exception occurs... Still, that's worked fine in the past. Anyone have any idea why my machine's debugging file/line numbers don't seem to match the decompiled classes anymore? I even went as far as remove the hapi-fhir core maven modules from my <user>/.m2 directory and forcing it to re-download them. Still no luck.
Sean McIlvenna
May 17, 2021, 9:48:19 PM5/17/21
to HAPI FHIR
Here's a screenshot for example... In the screenshot, the file/line in the stacktrace shows LibraryHelper.js:216, bu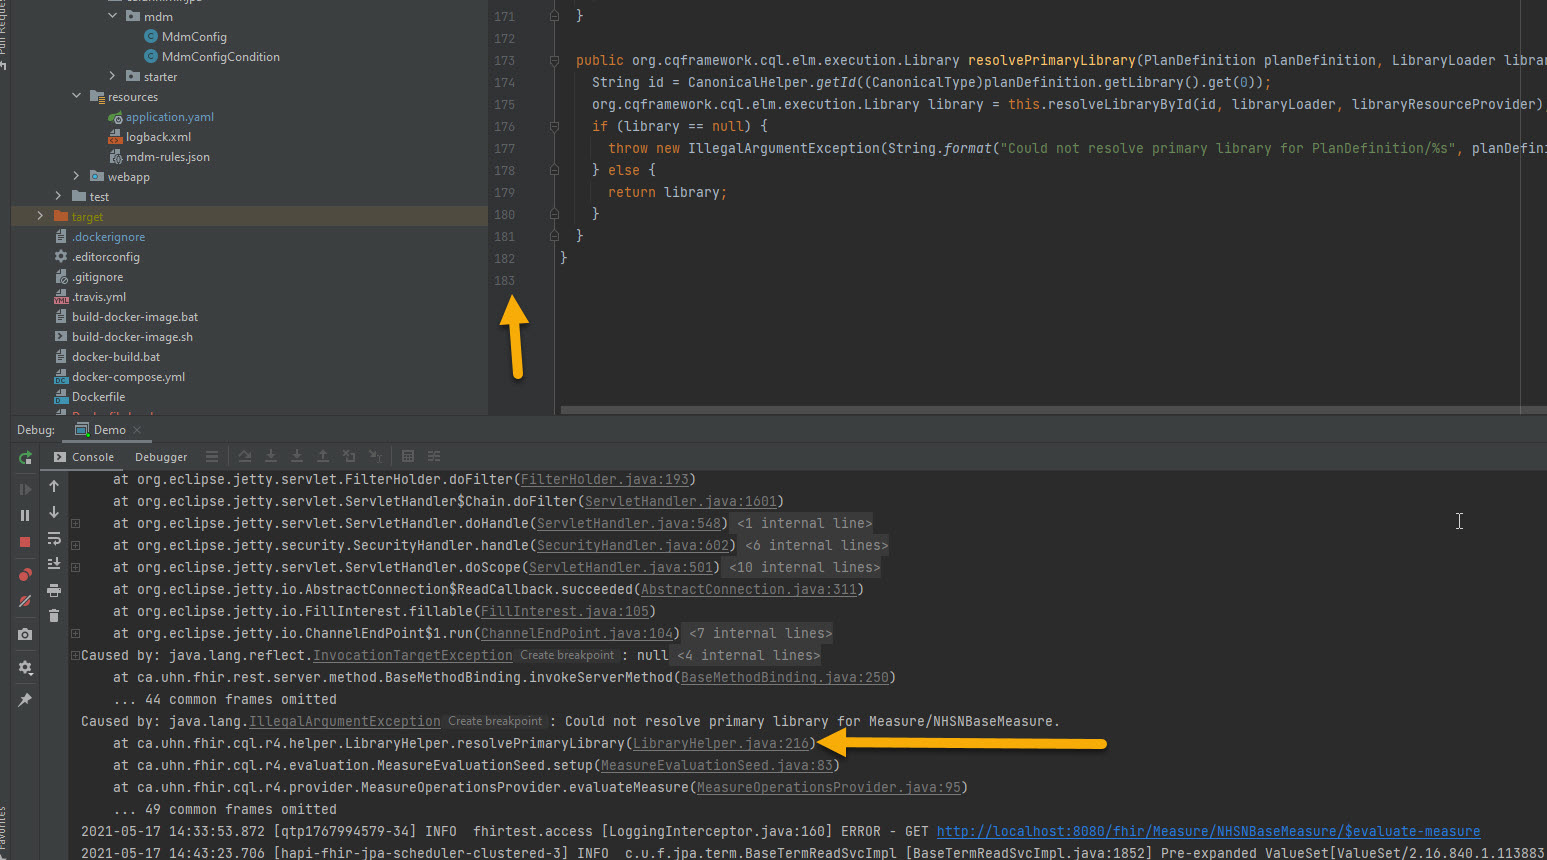 t there aren't even 216 lines in the decompiled LibraryHelper.java class.
t there aren't even 216 lines in the decompiled LibraryHelper.java class.Sean McIlvenna
May 17, 2021, 11:57:47 PM5/17/21
to HAPI FHIR
FYI, Keith pointed me towards "Download sources" option in IntelliJ, which seems to have fixed the problem. I had assumed that this was happening automatically when the dependencies in the pom.xml file changed; aparently not.
Thanks!
Reply all
Reply to author
Forward
0 new messages