Magnetogram distance and time.
16 views
Skip to first unread message

David Waugh
Aug 1, 2021, 8:15:44 PM8/1/21
to ham...@googlegroups.com, tanger...@lists.tapr.org
Group,
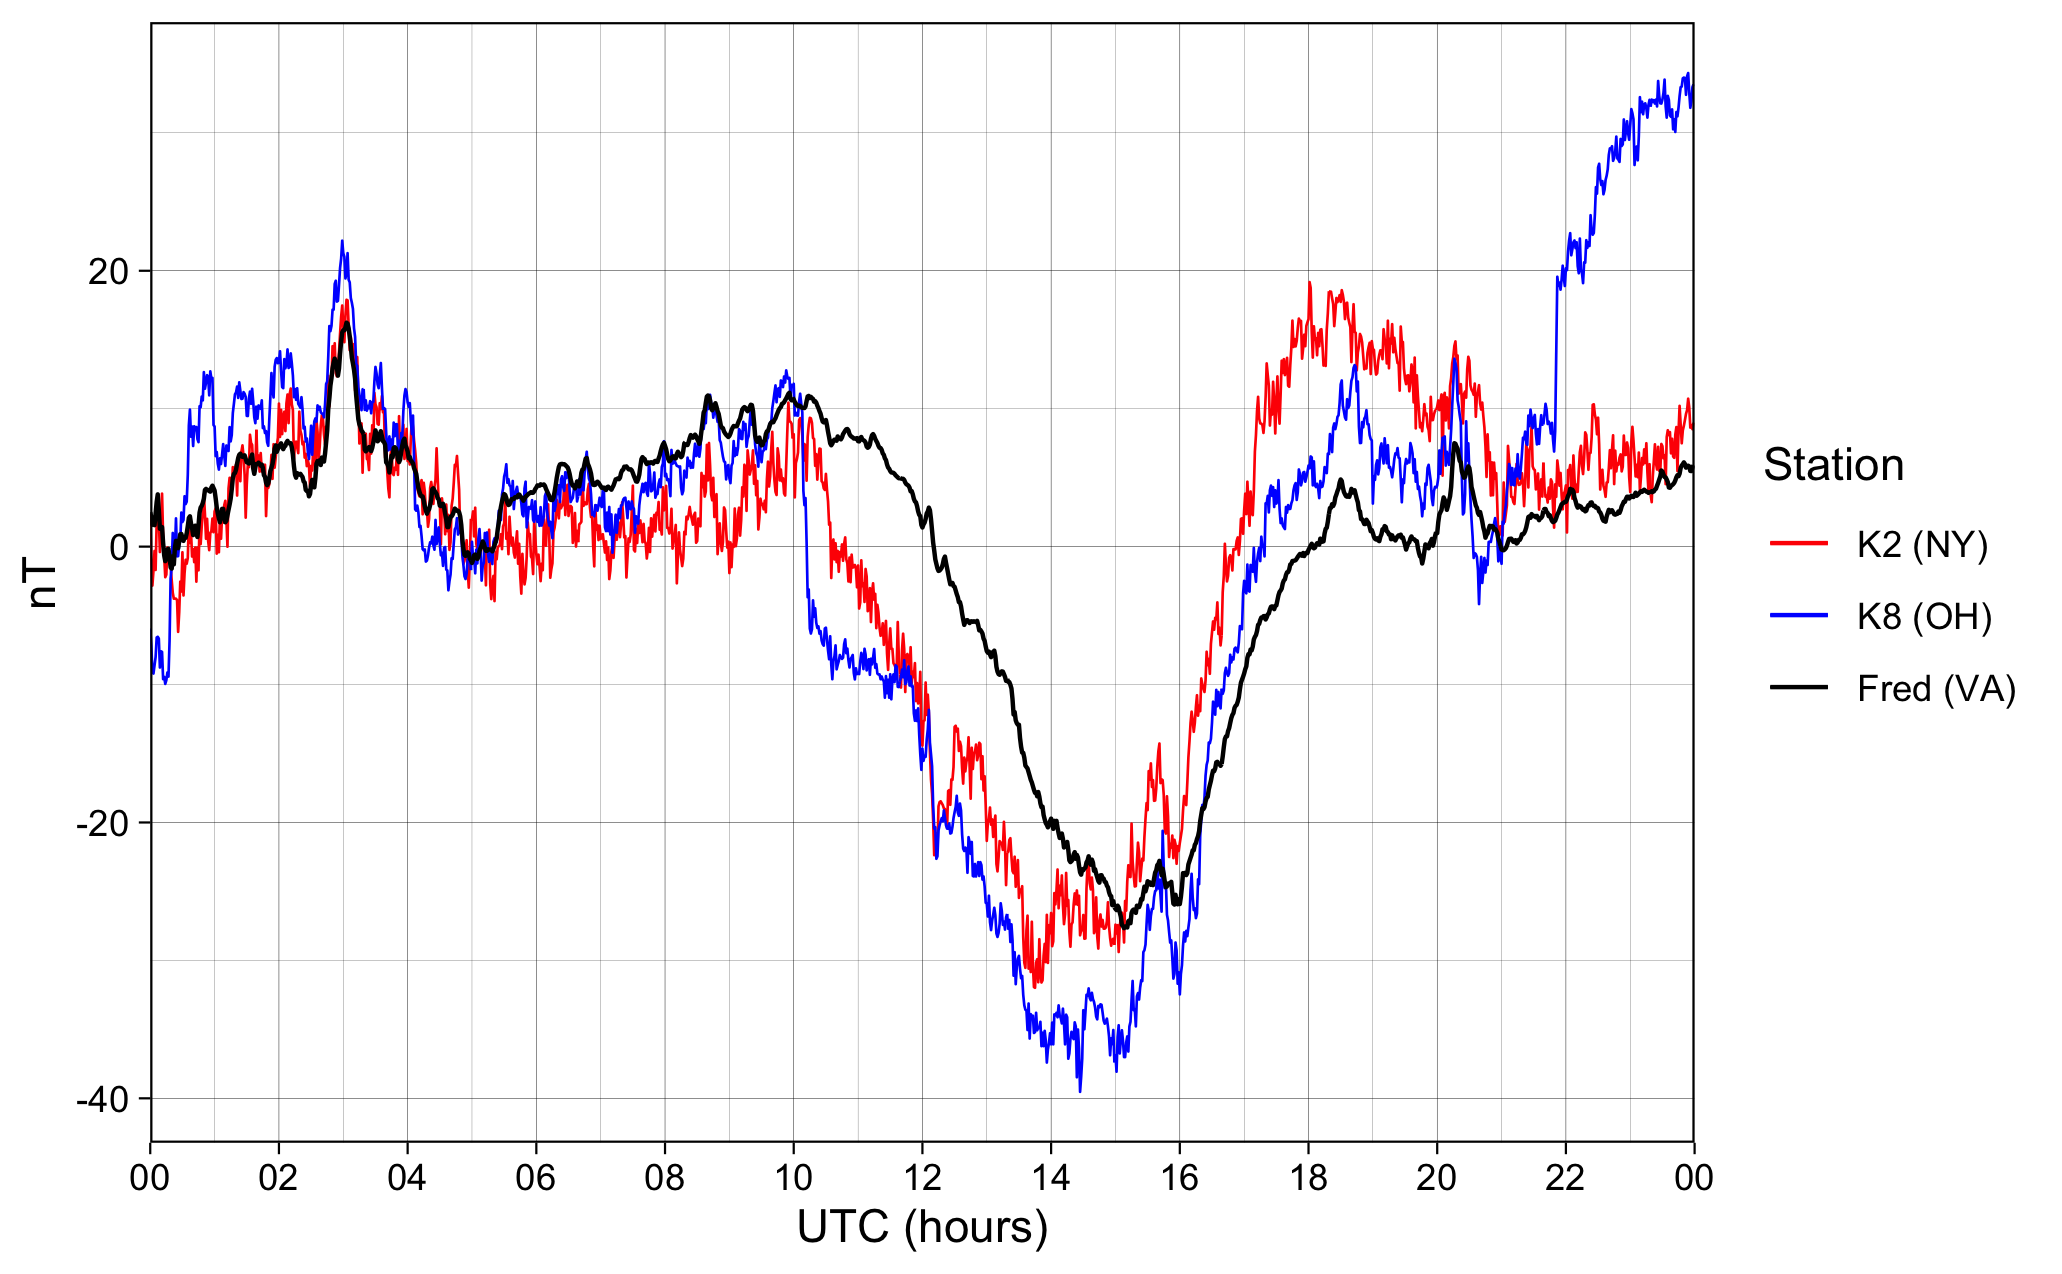
I’ve been thinking about how to evaluate magnetometer data in general, but am also interested to see if the data I am producing, in what might not be an ideal spot, is even useable. I’ve attached a short PDF which has some graphic and numeric comparisons between my station (in OH), Jules (in NY), and the interMagnet station in Fredericksburg, VA. Based on what I can tell, the few distance metrics I tried may not be especially useful (or even a useful approach) but looking at just the graphs I think our data looks fairly good. There is some literature on comparing magnetograms that I plan to to look at. Anyway, I’ve attached some of the data if anyone is curious.
One thing I did notice when trying to input the data from Jules and my stations is that there are different numbers of lines in each file. Looking further I realized that both our data sets are around 75,500 lines, while there are 86,400 in a day. I had never noticed that before, and seconds in a day is not number I knew or ever thought about. I had been compiling some basic stats on data uploaded to the site Dave Witten setup, and looking back at that data the average number of lines per day is 75,108, 75,553, 75,445, and 75,248, for each of the stations. The daily numbers for each station vary slightly, but generally stay close to those values. It seems the time stamps are accurate, it’s just that the spacing is slightly longer than one second. The screenshot below shows timestamps for Jules and myself with “missing” values straddled in yellow. This might be worth looking at, but I think the data being produced looks fairly good. -David KE8QEP
Reply all
Reply to author
Forward
0 new messages