Termination event?

Bob Gerzoff
From Spaceweather.com:
THE TERMINATION EVENT: Something big may be about to happen
on the sun. "We call it the Termination Event," says Scott McIntosh, a solar physicist at the National Center for Atmospheric Research (NCAR), "and it's very, very close to happening."
If you've never heard of the Termination Event, you're not alone. Many researchers have never heard of it either. It's a relatively new idea in solar physics championed by McIntosh and colleague Bob Leamon of the University of Maryland - Baltimore County.
According to the two scientists, vast bands of magnetism are drifting across the surface of the sun. When oppositely-charged bands collide at the equator, they annihilate (or "terminate"). There's no explosion; this is magnetism, not anti-matter. Nevertheless,
the Termination Event is a big deal. It can kickstart the next solar cycle into a higher gear.

Above: Oppositely charged bands of magnetism
march toward the sun's equator where they annihilate one another, kickstarting the next solar cycle. [more]
"If the Terminator Event happens soon, as we expect, new Solar Cycle 25 could have a magnitude that rivals the top few since record-keeping began," says McIntosh.
This is, to say the least, controversial. Most solar physicists believe that Solar Cycle 25 will be weak, akin to the anemic Solar Cycle 24 which barely peaked back in 2012-2013. Orthodox models of the sun's inner magnetic dynamo favor a weak cycle and do not even include the concept of "terminators."
"What can I say?" laughs McIntosh. "We're heretics!"
The researchers outlined their reasoning in a December 2020 paper in the research journal Solar Physics. Looking back over 270 years of sunspot data, they found that Terminator Events divide one solar cycle from the next, happening approximately every 11 years. Emphasis on approximately. The interval between terminators ranges from 10 to 15 years, and this is key to predicting the solar cycle.
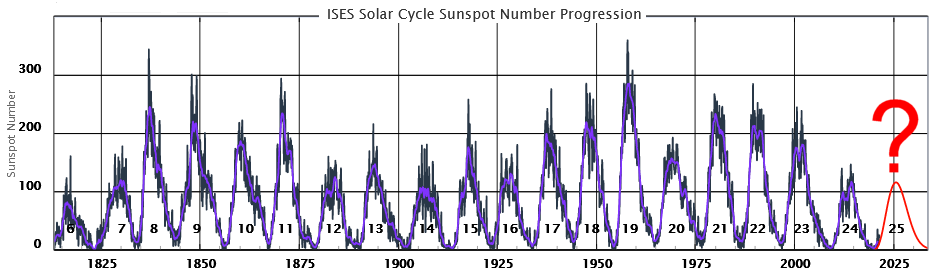
Above: Marked in red, the official
forecast for Solar Cycle 25 is weak.
"We found that the longer the time between terminators, the weaker the next cycle would be," explains Leamon. "Conversely, the shorter the time between terminators, the stronger the next solar cycle would be."
Example: Sunspot Cycle 4 began with a terminator in 1786 and ended with a terminator in 1801, an unprecedented 15 years later. The following cycle, 5, was incredibly weak with a peak amplitude of just 82 sunspots. That cycle would become known as the beginning of the "Dalton" Grand Minimum.
Solar Cycle 25 is shaping up to be the opposite. Instead of a long interval, it appears to be coming on the heels of a very short one, only 10 years since the Terminator Event that began Solar Cycle 24. Previous solar cycles with such short intervals have been among the strongest in recorded history.
These ideas may be controversial, but they have a virtue that all scientists can appreciate: They're testable. If the Termination Event happens soon and Solar Cycle 25 skyrockets, the "heretics" may be on to something. Stay tuned.

Khan Tran
--
Please follow the HamSCI Community Participation Guidelines at http://hamsci.org/hamsci-community-participation-guidelines.
---
You received this message because you are subscribed to the Google Groups "HamSCI" group.
To unsubscribe from this group and stop receiving emails from it, send an email to hamsci+un...@googlegroups.com.
To view this discussion on the web visit https://groups.google.com/d/msgid/hamsci/SA1PR13MB5071A043D93096A4977EE504D0349%40SA1PR13MB5071.namprd13.prod.outlook.com.

Frank Howell
Shameless promotion for those who wish a more in-depth understanding of the McIntosh team’s new theoretical approach emphasizing the Termination event:
ICQ Podcast Episode 332 - Exciting Bumper New Solar Cycle — ICQ Amateur / Ham Radio Podcast
73,
Frank
K4FMH
Sent from Mail for Windows 10
--

Peter Laws
>
> "What can I say?" laughs McIntosh. "We're heretics!"
moving us forward; the former not so much.
--
Peter Laws | N5UWY | plaws plaws net | Travel by Train!

James Secan
Jim
3222 NE 89th St
Seattle, WA 98115
(206) 430-0109
> On Jun 11, 2021, at 10:35 AM, Bob Gerzoff <b...@bobgerzoff.com> wrote:
>
> From Spaceweather.com:
>
> THE TERMINATION EVENT: Something big may be about to happen on the sun. "We call it the Termination Event," says Scott McIntosh, a solar physicist at the National Center for Atmospheric Research (NCAR), "and it's very, very close to happening."
>
> If you've never heard of the Termination Event, you're not alone. Many researchers have never heard of it either. It's a relatively new idea in solar physics championed by McIntosh and colleague Bob Leamon of the University of Maryland - Baltimore County. According to the two scientists, vast bands of magnetism are drifting across the surface of the sun. When oppositely-charged bands collide at the equator, they annihilate (or "terminate"). There's no explosion; this is magnetism, not anti-matter. Nevertheless, the Termination Event is a big deal. It can kickstart the next solar cycle into a higher gear.
>
>
> "If the Terminator Event happens soon, as we expect, new Solar Cycle 25 could have a magnitude that rivals the top few since record-keeping began," says McIntosh.
>
> This is, to say the least, controversial. Most solar physicists believe that Solar Cycle 25 will be weak, akin to the anemic Solar Cycle 24 which barely peaked back in 2012-2013. Orthodox models of the sun's inner magnetic dynamo favor a weak cycle and do not even include the concept of "terminators."
>
> "What can I say?" laughs McIntosh. "We're heretics!"
>
> The researchers outlined their reasoning in a December 2020 paper in the research journal Solar Physics. Looking back over 270 years of sunspot data, they found that Terminator Events divide one solar cycle from the next, happening approximately every 11 years. Emphasis on approximately. The interval between terminators ranges from 10 to 15 years, and this is key to predicting the solar cycle.
>
>
> "We found that the longer the time between terminators, the weaker the next cycle would be," explains Leamon. "Conversely, the shorter the time between terminators, the stronger the next solar cycle would be."
>
> Example: Sunspot Cycle 4 began with a terminator in 1786 and ended with a terminator in 1801, an unprecedented 15 years later. The following cycle, 5, was incredibly weak with a peak amplitude of just 82 sunspots. That cycle would become known as the beginning of the "Dalton" Grand Minimum.
>
> Solar Cycle 25 is shaping up to be the opposite. Instead of a long interval, it appears to be coming on the heels of a very short one, only 10 years since the Terminator Event that began Solar Cycle 24. Previous solar cycles with such short intervals have been among the strongest in recorded history.
>
> These ideas may be controversial, but they have a virtue that all scientists can appreciate: They're testable. If the Termination Event happens soon and Solar Cycle 25 skyrockets, the "heretics" may be on to something. Stay tuned.
>
>
>

Carl Luetzelschwab
Carl K9LA
Frank M. Howell
On Jun 11, 2021, at 4:59 PM, Carl Luetzelschwab <carlluet...@gmail.com> wrote:
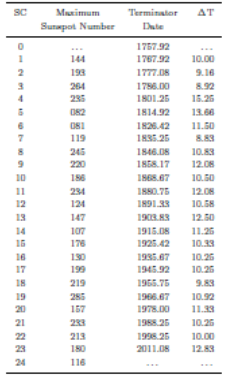
The McIntosh prediction is based on the correlation between the time difference between the termination dates of Cycles N and N-1 (delta T), and the smoothed sunspot magnitude of Cycle N+1. Here are the termination dates from their paper (Table 1).
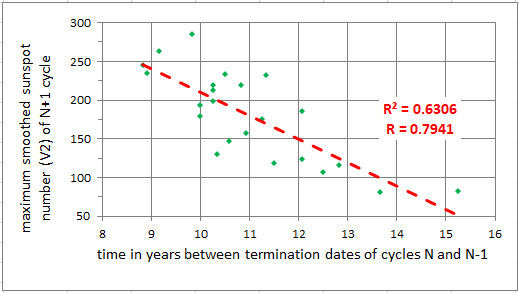
<image.png>Here's my scatter diagram of the data points.
<image.png>In the paper, the estimate for the termination date of Cycle 24 was April 2020. So 2020.37 - 2011.08 (termination date of Cycle 23) = 9.29 years. Enter that on the above plot and you get around 229. That's a big cycle, as the average for all 24 cycles is 179 (per the V2 sunspot record).The termination date for Cycle 24 has not yet occurred. So right now the initial estimate is off by about 1 year and a couple months. Plugging in the new delta T (about 10.5 years if the termination date occurs in June 2021) gives a maximum sunspot number of around 190. Still a bigger than average cycle - but not by much.But per the non-perfect correlation, the maximum sunspot number for Cycle 25 could be anywhere from 125 to 225. I think all we can do is wait to see what really happens.
Carl K9LA
--
Please follow the HamSCI Community Participation Guidelines at http://hamsci.org/hamsci-community-participation-guidelines.
---
You received this message because you are subscribed to the Google Groups "HamSCI" group.
To unsubscribe from this group and stop receiving emails from it, send an email to hamsci+un...@googlegroups.com.
To view this discussion on the web visit https://groups.google.com/d/msgid/hamsci/CAAx1FFF-HqEWdg0f1%3DTdYLsce7BeCtuQQd-qVNsL44B4i6vJ6Q%40mail.gmail.com.
Frank M. Howell
On Jun 11, 2021, at 5:19 PM, Frank M. Howell <frankm...@gmail.com> wrote:
Carl Luetzelschwab
Carl K9LA
Frank M. Howell
On Jun 12, 2021, at 7:42 AM, Carl Luetzelschwab <carlluet...@gmail.com> wrote:
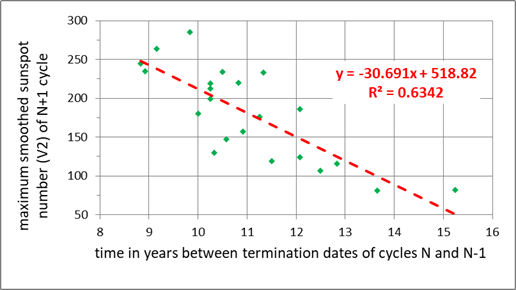
Frank,Thanks for the additional comments. If my calculations are correct (I don't find MSE in the Excel options), the MSE is 1255 when using the trend line equation (I also had an extra data set in the original plot).
Carl K9LA
<image.png>
--
Please follow the HamSCI Community Participation Guidelines at http://hamsci.org/hamsci-community-participation-guidelines.
---
You received this message because you are subscribed to the Google Groups "HamSCI" group.
To unsubscribe from this group and stop receiving emails from it, send an email to hamsci+un...@googlegroups.com.
To view this discussion on the web visit https://groups.google.com/d/msgid/hamsci/CAAx1FFHxo2SvL6iGf3rojvGRaSHjcjZjqANg9RVb4_UAKLVaHQ%40mail.gmail.com.

Black Michael

Please follow the HamSCI Community Participation Guidelines at http://hamsci.org/hamsci-community-participation-guidelines.
---
You received this message because you are subscribed to the Google Groups "HamSCI" group.
To unsubscribe from this group and stop receiving emails from it, send an email to hamsci+un...@googlegroups.com.
To view this discussion on the web visit
Frank M. Howell
On Jun 12, 2021, at 8:09 AM, 'Black Michael' via HamSCI <ham...@googlegroups.com> wrote:
An exponential fit is a bit better fit...mother nature tends to be non-linear in a lot of places.Have to be careful with only 22 points.
<1623503253532blob.jpg>Mike W9MDB
--On Saturday, June 12, 2021, 07:42:42 AM CDT, Carl Luetzelschwab <carlluet...@gmail.com> wrote:Frank,Thanks for the additional comments. If my calculations are correct (I don't find MSE in the Excel options), the MSE is 1255 when using the trend line equation (I also had an extra data set in the original plot).
Carl K9LA--https://groups.google.com/d/msgid/hamsci/CAAx1FFHxo2SvL6iGf3rojvGRaSHjcjZjqANg9RVb4_UAKLVaHQ%40mail.gmail.com
Please follow the HamSCI Community Participation Guidelines at http://hamsci.org/hamsci-community-participation-guidelines.
---
You received this message because you are subscribed to the Google Groups "HamSCI" group.
To unsubscribe from this group and stop receiving emails from it, send an email to hamsci+un...@googlegroups.com.
To view this discussion on the web visit.
Please follow the HamSCI Community Participation Guidelines at http://hamsci.org/hamsci-community-participation-guidelines.
---
You received this message because you are subscribed to the Google Groups "HamSCI" group.
To unsubscribe from this group and stop receiving emails from it, send an email to hamsci+un...@googlegroups.com.

To view this discussion on the web visit https://groups.google.com/d/msgid/hamsci/225464846.3546940.1623503358943%40mail.yahoo.com.
<1623503253532blob.jpg>
Frank Howell
Carl,
I had to go do the weekly yardwork but forgot to mention this, too..
Your numbers are smoothed SSNs, right? Let’s keep in mind why we smooth data, especially time-series. It’s because the “real” observations vary enough to mask the trend to the human eye. But in taking “t” lags (e.g., 7 periods, etc.), we are reducing the actual observed temporal variability. So when we are trying to predict the actual variability using smoothed time-series observations, our predicted values (especially if they are out of scope of the observed window) are in “smoothed” values, not the actual phenomenon we are studying. Scott McIntosh reminded me of this smoothing in your observed data off-list.
One thing that my interview of Dr. McIntosh about his team’s work showcased is that he (they) have a NEW THEORY of sunspot cycle phenomena, not the extant official paradigm that still holds sway in most circles. Is their theory going to give us a better way of understanding SSNs in the context of the Hale Cycle and related phenomena? We will have to wait a bit longer but this is what makes science much more interesting. Competing theoretical paradigms on the cusp of “revolution” as Thomas Kuhn and others have described!
Thanks for the continued work on prop events, Carl. I’ve always enjoyed your presentations and have learned quite a bit from many of them.
Frank Howell
Here’s a website that more clearly illustrates the empirical realization of the competing paradigms:
https://helioforecast.space/solarcycle
Scott sent it to me off-list…
Carl Luetzelschwab
Frank Howell
Indeed, Carl. This may be my last SS peak….and for too many hams.
From: Carl Luetzelschwab
Sent: Saturday, June 12, 2021 11:15 AM
To: ham...@googlegroups.com
Cc: Scott McIntosh
Subject: Re: [HamSCI] Termination event?
Frank,
--
Please follow the HamSCI Community Participation Guidelines at http://hamsci.org/hamsci-community-participation-guidelines.
---
You received this message because you are subscribed to the Google Groups "HamSCI" group.
To unsubscribe from this group and stop receiving emails from it, send an email to hamsci+un...@googlegroups.com.
To view this discussion on the web visit https://groups.google.com/d/msgid/hamsci/CAAx1FFEmp_bd8JtUqu%3DpmyF5zO%3D-6WwGjKxLMKot7SigRvmYGA%40mail.gmail.com.
Peter Laws
<ham...@googlegroups.com> wrote:
>
> Have to be careful with only 22 points.
>
over my head by a couple wavelengths. BUT ... this bit is worth
repeating.
Please repeat it to all the doomsayers in the amateur community who
(at least a few years ago) were loudly proclaiming we had obviously
entering a new "Maunder Minimum" based on ... their reading about
research done on 24 solar cycles' worth of data out of ... what? 450M
cycles? And even that large number assumes a reasonably constant
cycle of +/-11 Earth orbits ...

Gerald Creager
Capt Gerry Creager, CAP
SWR Health Services Officer(C) 979.229.5301
Civil Air Patrol, U.S. Air Force Auxiliary
gocivilairpatrol.com
To view this discussion on the web visit https://groups.google.com/d/msgid/hamsci/6DA90D2B-809A-4102-8BCC-7342666EBE95%40hxcore.ol.
Frank M. Howell
On Jun 12, 2021, at 7:07 PM, Gerald Creager <gcre...@cap.gov> wrote:
To view this discussion on the web visit https://groups.google.com/d/msgid/hamsci/CAG3zga6DSwN9XAR3oVw4Tr%3DWhsfE7U-YwjDRCpjgMXfpAXaK3g%40mail.gmail.com.