Wisconsin Econ Data Visualization Project

Carl Schroedl

Aaron Couch

Online: http://nucivic.com
--
You received this message because you are subscribed to the Google Groups "HackingMadison" group.
To unsubscribe from this group and stop receiving emails from it, send an email to hackingmadiso...@googlegroups.com.
To post to this group, send email to hacking...@googlegroups.com.
To view this discussion on the web visit https://groups.google.com/d/msgid/hackingmadison/7dc4ba52-4475-470c-8cff-fb2e8fdd4528%40googlegroups.com.
Carl Schroedl
Aaron,
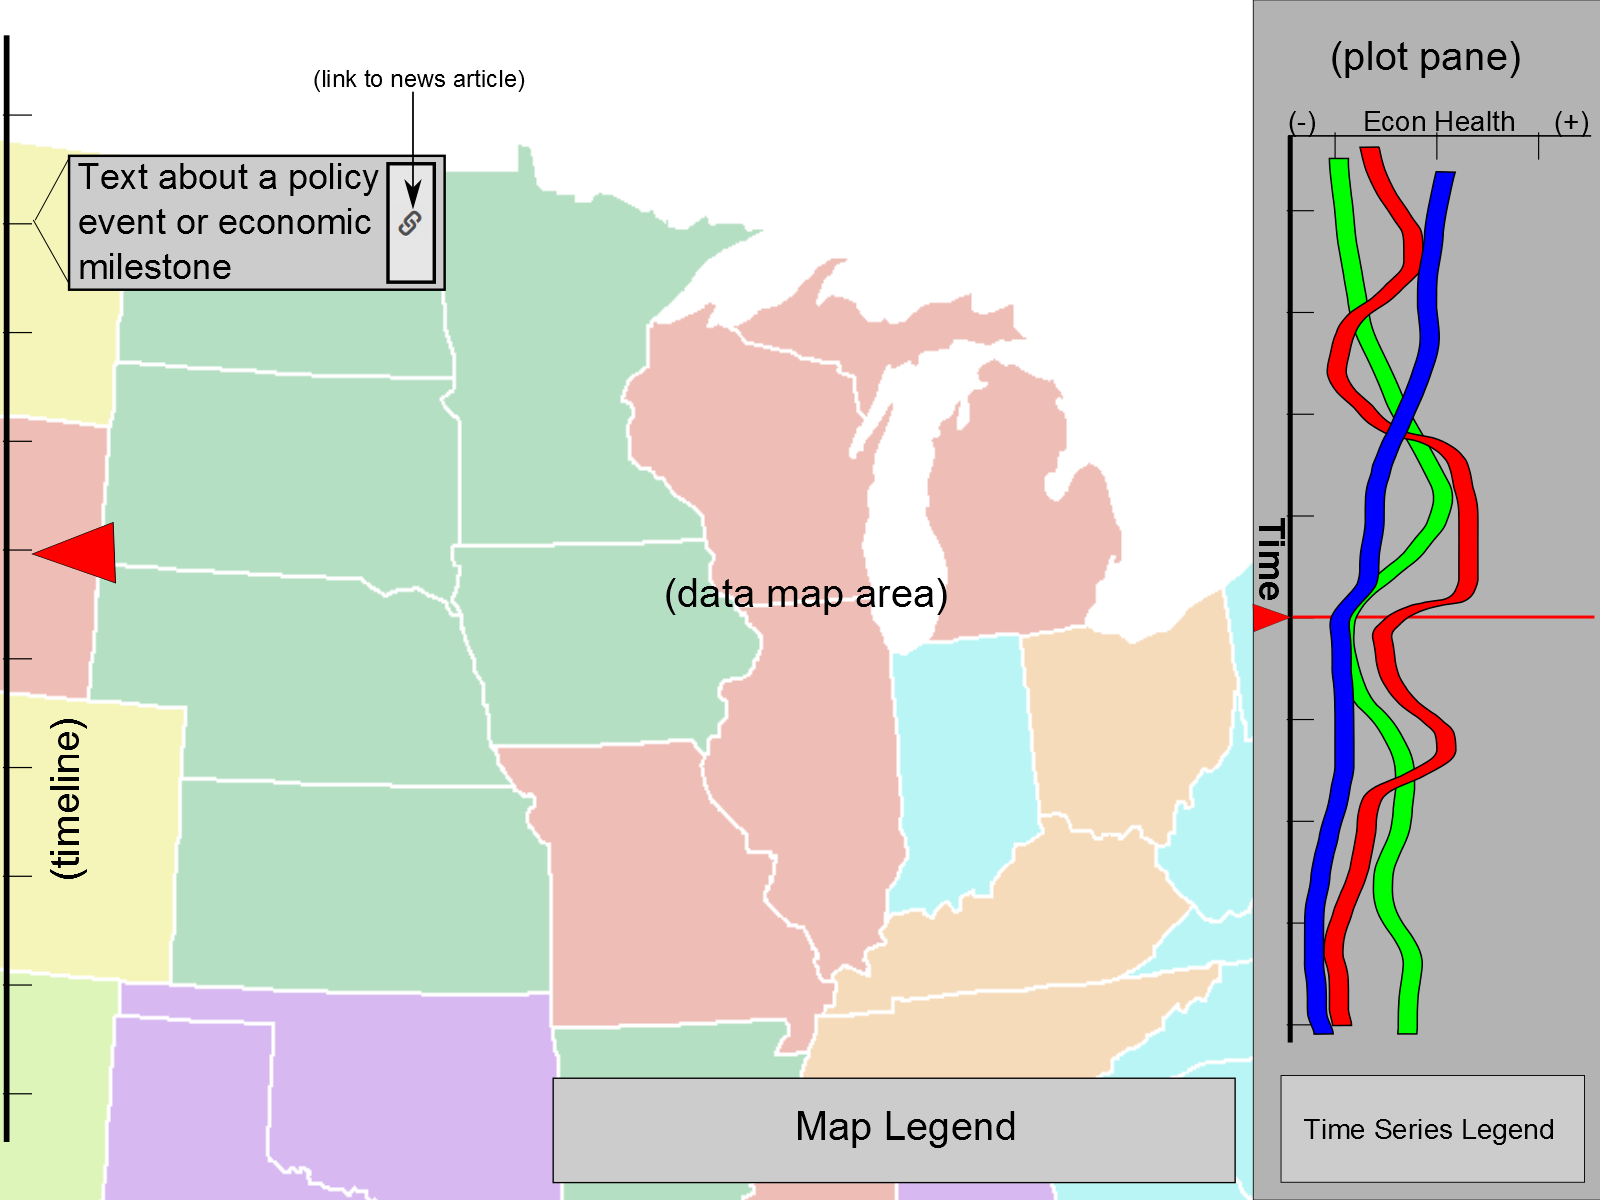
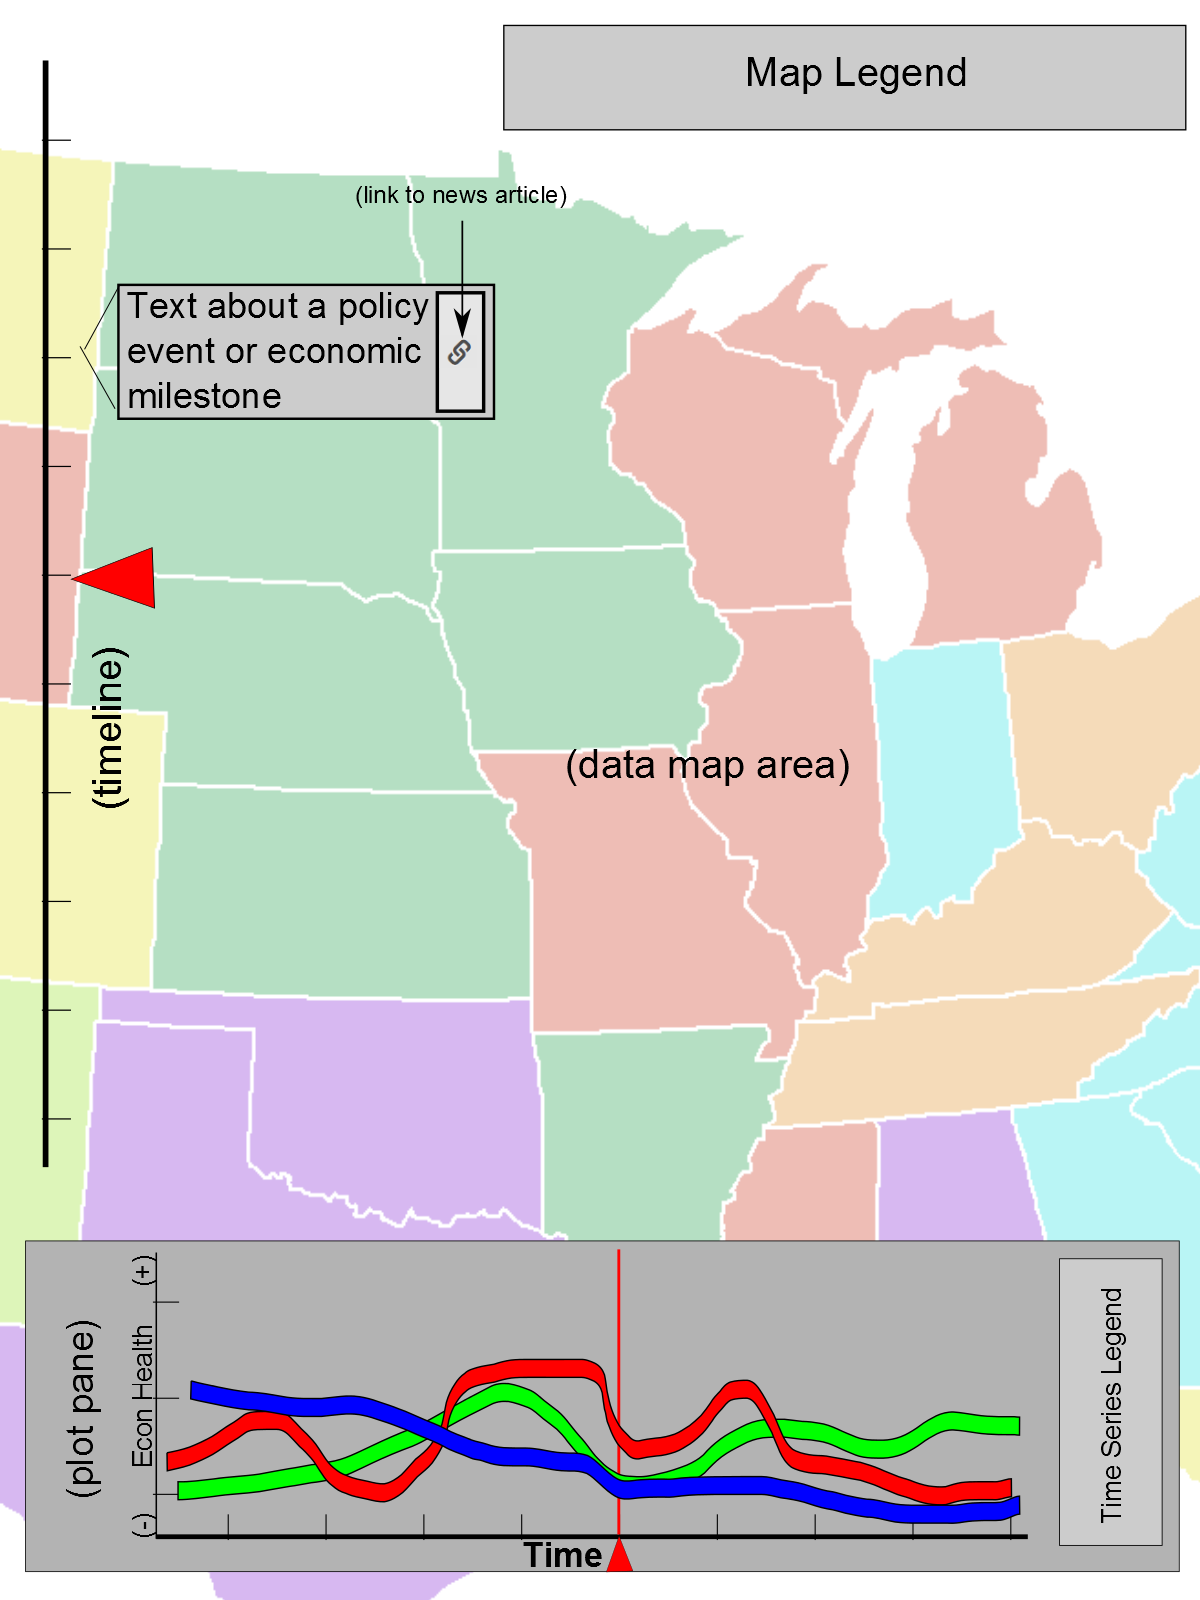
We aim to compare Wisconsin's post-recession recovery with that of other states in the region using publicly-available data. Since this experience targets the layperson, we favor a simple, compelling visualization of a few data sets rather than creating a complicated tool that requires expertise to interpret. We plan to visualize economic data via maps and time series plots. We strive to visualize economic data in the same context as relevant policy news so that users contemplate the relationship between policy and economic trends.
Currently we want users to scroll through a vertical timeline that has links to articles detailing milestones in economic policy. See my attached eyesores... I mean, mockups ;) Dylan could totally blow my mockups out of the water, but I beat him to it. Anyways, while the articles scroll past, the map stays on screen, but the coloring of the states within the map changes. We want to put the map and the timeline’s currently-visualized time step in the context of longer-term trends. We think that displaying the currently-visualized time step as a hairline on a time series plot would do the trick.
As you can see, we've still got some details to fill in. We hope to refine our ideas by bringing more economic, journalistic, and technical expertise into the conversation. We need feedback from economists to help us hone in on the most relevant economic data. We need research from journalists to help define which news articles are representative of recent economic and political events. The implementation will inevitably evolve as we iteratively approach better notions of which data sets are important, and who the contributors will be. We plan to develop in an agile fashion, to use formal issue tracking, and to use distributed version control. We will hammer out additional development details as needed.
Outside of this project, we have full-time commitments too. Like any open-source project, when it comes to tasking and scheduling we respect contributors’ varying ability to commit time, and contributors’ varying interests in tasks.
So, Aaron, if you are interested and able, we would love to talk more about what you are interested in, what we can learn from each other, and what we might accomplish together. Max-respect for developing DKAN. The government is getting serious about open-sourcing data, so I hear about DKAN's cousin TKAN at work from time to time. I’d like to hear more about DKAN too.