h2o.deeplearning on a regression example
2,489 views
Skip to first unread message

johnwa...@gmail.com
Apr 22, 2015, 4:18:34 PM4/22/15
to h2os...@googlegroups.com
Hello,
First up, I just started to play with h2o and thanks for the h2o team for this great software.
I have a question for a toy regression example below, where the y variable is
a function of X1 and X2, plus some noise. The X1, X2, and epsilon are all random norms: Y= 0.05*X1 + 0.025*X2 + 0.05*X1*abs(X2)+epsilon
I split data into half, train a model in first half, then predict for second half. With OLS or deepnet, I get pretty similar results(at least for deepnet+sigmoid activation).
But with h2o's deeplearning, it's hard for me to match OLS or deepnet's performance.
I show the results for OLS, deepnet and h2o.deeplearning results below, also the R code. I use 2 layers with 40 neurons each for comparison.
1) -- summary of outsample and insample R2s for a few setups:
hidden R2.out R2.in notes
A). OLS
NA 0.008678 0.005985
B). deepnet: 5 different setups
40,40 0.008600974 0.005916587 act="sigm"
40,40 0.008635492 0.005937487 act="sigm", another run
40,40 0.007608 0.008087 act="tanh"
40,40 0.008037 0.00571 act="tanh", hidden dropout=0.5, visible dropout=0.5
40,40 0.00755 0.005695 act="tanh", hidden dropout=0.75, visible dropout=0.75
C). h2o: 3 sample runs
40,40 0.003824 0.01321 act="tanh", input_dropout_ratio = c(0),hidden_dropout_ratios = c(0.5,0.5),
40,40 0.007317 0.008989 act="tanh", input_dropout_ratio = c(0.5),hidden_dropout_ratios = c(0.5,0.5),
40,40 0.006079 0.009535 another run as above
From above, OLS shows best out-sample performance. This could make sense as the data in this case is quite linear(
there is some small nonlinearity from multiplication, but I'm not sure the neural net was able to model that).
Anyway, with deepnet, at least with actvation=sigmoid, I could easily reproduce almost exactly same results as OLS. With deepnet+tanh, the out-sample performance is slightly worse.
But with h2o, we only have tanh(no sigmoid), and I've tried many settings, very hard to match OLS.
In short, in this simple toy example, h2o is much harder to train to match up deepnet
or OLS's outsample performance. I wonder whether it is due to my selection of parameters or something
wasn't setup correctly ?
2). questions:
a). does h2o output unit also uses a linear function (not tanh)?
The deepnet doesn't transform output unit with sigmoid for regressions by default.
I would assume h2o does the same, but haven't found it in its documentation.
b). What bothers me most is that, for h2o, the predicted value has pretty weird distributions
sometimes(compared to OLS or deepnet's predictions). This can happen quite often, depending on parameter settings.
For example, sometimes, the distribution of predicted values could concentrate around the mean value, or sometimes, it could have 2 peaks, as shown in the plot I attached. For OLD and deepnet, usually the predicted value distribution is more smooth.
What caused h2o's uneven prediction distributions? Is it just random and why it happens often?
(ok, seems not easy to attach a picture in google group, I'll just say that OLS and deepnet predictions are more like Gaussian with peaks around zero, but h2o predictions in that particular run is not like Gaussian at all with 2 peaks at -0.1 and 0.1)
c). was it because of tanh vs sigmoid ? Why tanh in deepnet also did worse than sigmoid?
For deeptnet, I scaled my y variable into [0,1]. For h2o, it's raw y variables(roughly mean 0 and std=1), but
according to h2o documentation, it automatically scales it to have mean 0 and unit std.
I would appreciate any comments on h2o vs deepnet difference, and also how to tune h2o to match deepnet or OLS in this examples.
Thanks,
John
3). ----- R code
toy regression example with OLS, deepnet, and h2o deeplearning methods.
###### 1). data preparation
### X1 and X2 are rnorm
### Y= 0.05*X1 + 0.025*X2 + 0.05*X1*abs(X2)+epsilon
set.seed(301)
N=5040 # number of rows
data <- as.data.frame( cbind(1:N, matrix(rnorm(2*N), ncol=2)) )
colnames(data) <- c("ID",paste("X",1:2,sep=""))
# noise
noise<- as.data.frame(rnorm(N))
names(noise)="noise"
b1=0.05
b2=0.025
b3=0.05
stdNoise=1
#yvar
yvar= as.data.frame(b1*data$X1+b2*data$X2+b3*data$X1*abs(data$X2)+stdNoise*noise)
names(yvar)=c("Y")
#combine all
data=cbind(data,yvar, noise)
#add scaled y such that it's between 0-1, for deepnet
min=min(data$Y)
max=max(data$Y)
scale=max-min
data$YScl<- (data$Y -min)/scale
# split data into train and test
dataTrain<- data[data$ID< 2600,]
dataTest<- data[data$ID>= 2600,]
summary(data)
> summary(data)
ID X1 X2 Y noise YScl
Min. : 1 Min. :-3.433766 Min. :-3.201729 Min. :-3.697055 Min. :-3.580720 Min. :0.0000
1st Qu.:1261 1st Qu.:-0.663225 1st Qu.:-0.683403 1st Qu.:-0.692370 1st Qu.:-0.673919 1st Qu.:0.4022
Median :2520 Median :-0.027207 Median :-0.009168 Median : 0.017945 Median : 0.015181 Median :0.4972
Mean :2520 Mean :-0.009551 Mean : 0.000382 Mean :-0.003449 Mean :-0.002627 Mean :0.4944
3rd Qu.:3780 3rd Qu.: 0.666797 3rd Qu.: 0.663464 3rd Qu.: 0.686218 3rd Qu.: 0.689008 3rd Qu.:0.5867
Max. :5040 Max. : 3.886974 Max. : 3.509467 Max. : 3.774207 Max. : 3.756700 Max. :1.0000
##### 2). simple OLS
## train
fit1<-lm(Y ~ X1+X2,data=dataTrain)
summary(fit1)
predOLSIn=fit1$fitted
# test
predOLS<- predict.lm(fit1, newdata=dataTest)
plot(predOLS,dataTest$Y)
fit2<-lm(Y ~ predOLS,data=dataTest)
summary(fit2)
##### 3). deepnet: deep neural network by Xiao Rong
library(deepnet)
# deepnet wants x as matrix, also I feed scaled y to deepnet
xTrain <- as.matrix(model.matrix(~ X1+X2-1, dataTrain))
xTest <- as.matrix(model.matrix(~ X1+X2-1, dataTest))
yTrain <- dataTrain$YScl # note y is scaled
## deepnet uses sae( stacked auto-encoder) as pre-training for deep neural network
dnn <- sae.dnn.train(xTrain,
yTrain,
hidden = c(40,40), # 2 hidden layers are 40 neurons each
activationfun = "tanh", # can be sigm as well
learningrate = 0.01,
numepochs = 200,
hidden_dropout = 0.5,
visible_dropout = 0.5,
sae_output="linear", # function for output unit, default is linear
batchsize = 10)
## out-sample
## predict by dnn for test
predDN<- nn.predict(dnn, xTest)
# scale yScl back to original scale
predDN<-predDN*scale+min
plot(predDN,dataTest$Y)
fit2<-lm(Y ~ predDN,data=dataTest)
summary(fit2)
## insample
predDNIn<- nn.predict(dnn, xTrain)
predDNIn<-predDNIn*scale+min
plot(predDNIn,dataTrain$Y)
fit3<-lm(Y ~ predDNIn,data=dataTrain)
summary(fit3)
##### 4). h20 deep net
library(h2o)
localH2O <- h2o.init(ip = "localhost", port = 54321, startH2O = TRUE)
## Convert data into H2O
train_h2o <- as.h2o(localH2O, dataTrain)
test_h2o <- as.h2o(localH2O, dataTest)
#h2o deep net
model <- h2o.deeplearning(x=c(2:3), # x is 2dn snd 3rd columns
y=4, # y is 4th column, un-scaled
data=train_h2o,
classification = FALSE,
hidden=c(40,40),
epochs=100,
activation="Tanh",
adaptive_rate=TRUE,
input_dropout_ratio = c(0.5), # % of inputs dropout
hidden_dropout_ratios = c(0.5,0.5), # % for nodes dropout
train_samples_per_iteration = -1, # use all data, not sampled
)
## outsample
## Converting H2O format into data frame
df_yhat_test <- as.data.frame(h2o.predict(model, test_h2o) )
predH2O<- df_yhat_test$predict
plot(predH2O,dataTest$Y)
fit2<-lm(Y ~ predH2O,data=dataTest)
summary(fit2)
## in sample
df_yhat_train <- as.data.frame(h2o.predict(model, train_h2o) )
predH2OIn<- df_yhat_train$predict
plot(predH2OIn,dataTrain$Y)
fit2<-lm(Y ~ predH2OIn,data=dataTrain)
summary(fit2)
pdf("hist_h2o.pdf")
par(mfrow=c(3,1))
hist(predOLSIn, nclass=100)
hist(predDNIn,nclass=100)
hist(predH2OIn,nclass=100)
dev.off()

Arno Candel
Apr 23, 2015, 3:00:29 AM4/23/15
to h2os...@googlegroups.com, johnwa...@gmail.com
Thanks John,
I will try to reproduce soon. For tiny models such as in your case, it make sense to use reproducible=T, which forces single-threaded operation. That can be more accurate as you avoid race conditions between multiple threads. The default settings are for large models with hundreds of thousands of weights and multi-node operation with dozends to hundreds of cores total (business use case).
Never ran OLS or deepnet.
2a) Yes, linear output for regression.
2b) try reproducible=T
2c) Tanh is equivalent to sigmoid, it's just a different bias and all weights in the input layer are scaled by 2.
Let me know if reproducible=T doesn't solve your issue. H2O Deep Learning has been proven to be highly accurate and scalable to much larger problems than hidden=c(40,40) :)
Pointer to a performance tuning guide:
Thanks,
Arno
Arno Candel
Apr 23, 2015, 3:16:29 AM4/23/15
to h2os...@googlegroups.com, johnwa...@gmail.com
Found it, adaptive learning rate didn't help in this case.
So I set rate=0.1 and set adaptive_rate=F to reproduce the behavior of deepnet (with much faster runtime, and without pre-training :)):
#h2o deep net
model <- h2o.deeplearning(x=c(2:3), # x is 2dn snd 3rd columns
y=4, # y is 4th column, un-scaled
training_frame=train_h2o,
hidden=c(40,40),
epochs=100,
rate=0.1,
activation="Tanh",
adaptive_rate=F,
input_dropout_ratio = c(0.5), # % of inputs dropout
hidden_dropout_ratios = c(0.5,0.5), # % for nodes dropout
train_samples_per_iteration = -1, # use all data, not sampled
)
I get R2.out 0.008501 and R2.in 0.00579 in multi-threaded mode.
Hope this helps,
Arno
Arno Candel
Apr 23, 2015, 3:46:31 AM4/23/15
to h2os...@googlegroups.com, johnwa...@gmail.com
A few notes/remarks:
1) I used h2o-dev, but you can still use H2O, just keep data=... and classification=F around.
2) You didn't specify activation="TanhWithDropout", so the hidden dropout ratios will be ignored. Not sure why you would want to regularize that strongly with only 40 hidden neurons in each layer, but it doesn't seem to hurt.
3) Not sure why you use 50% input dropout, that removes one of the two inputs for every training point, so you only see either X1 or X2, but never both. This will hardly help to train either, I would imagine, but is a nice test.
3) Not sure why you use 50% input dropout, that removes one of the two inputs for every training point, so you only see either X1 or X2, but never both. This will hardly help to train either, I would imagine, but is a nice test.
4) The problem is so simple that with even just one epoch, you will get similar results.
5) Thanks again for looking into H2O Deep Learning and for the helpful script!
On Wednesday, April 22, 2015 at 1:18:34 PM UTC-7, johnwa...@gmail.com wrote:
johnwa...@gmail.com
Apr 23, 2015, 12:15:35 PM4/23/15
to h2os...@googlegroups.com, johnwa...@gmail.com
Hi Arno,
Many thanks for your prompt reply!
Following your suggestions, I did a few runs(just to have a sense of variations if I don't set a random seed) for each of 4 scenarios, and the results are shown below.
I think scenario A is best, even slightly beating OLS or deepnet (B is slightly worse than A when adding hidden dropout regularization).
For A, it does look that specifying a rate=0.1 or 0.05 and also setting reproducible=TRUE helped a lot.
Setting reproducible=FALSE is not too helpful as shown in D in this small example. The distribution of predictions is also much better now.
Still a few more questions:
a). For scenario A(also other scenarios), the predictions are all negative now, any idea on why and how to fix it? Seems like some bias problem.
b). For your comment below, could you confirm? I'm not certain, but I think I saw outsample performance improved when I set activation="Tanh" and turned hidden dropout ratios. Maybe I just saw random variations.
d). This is a more general question, does deep net model the multiplicative interaction like X1*X2? I think some people said that if you create complicated enough structures, it will. But, is there a better/more intuitive way?
e). For your comment below, comparing scenario A vs C, it seems 50% input dropout actually helped. My guess is since X2 is nonlinear (due to abs(X2) term), maybe it's easier for the h2o to fit nonlinear X2 alone than fitting X1 and X2 together with the currently specified setup, sort of like random forest's idea of randomized input variables.
Regards,
John
-- a few scenarios, each scenario has a few runs with same parameter setup
hidden R2.out R2.in
A). --with reproducible=TRUE and input_dropout_ratio = c(0.5), activation="Tanh",
40,40 0.009439 0.005562
40,40 0.008917 0.00584
40,40 0.009044 0.005801
40,40 0.008925 0.005835
40,40 0.009436 0.005458
note: predictions are all negative(sometimes all positive, but less often)
B). --with reproducible=TRUE and input_dropout_ratio = c(0.5), activation="TanhWithDropout"(hidden drop ratios set to 0.5)
40,40 0.007178 0.005527
40,40 0.008892 0.005651
40,40 0.008891 0.00544
40,40 0.008451 0.005037
40,40 0.009152 0.005001
C). --with reproducible=TRUE and no input_dropout_ratio
40,40 0.005201 0.004876
40,40 0.004469 0.004405
40,40 0.008115 0.00585
D). --with reproducible=FALSE and input_dropout_ratio = c(0.5) ( activation="Tanh")
40,40 0.007818 0.007129
40,40 9.161e-05 0.0002582
40,40 0.007059 0.005604
OLS(2 xs) 0.0087 0.006
OLS(3 xs) 0.0098 0.0063
## -- modified call to h2o according to Arno, Scenario A
activation="Tanh",
adaptive_rate=FALSE,
reproducible=TRUE,
#seed=71,force_load_balance=FALSE,
Many thanks for your prompt reply!
Following your suggestions, I did a few runs(just to have a sense of variations if I don't set a random seed) for each of 4 scenarios, and the results are shown below.
I think scenario A is best, even slightly beating OLS or deepnet (B is slightly worse than A when adding hidden dropout regularization).
For A, it does look that specifying a rate=0.1 or 0.05 and also setting reproducible=TRUE helped a lot.
Setting reproducible=FALSE is not too helpful as shown in D in this small example. The distribution of predictions is also much better now.
Still a few more questions:
a). For scenario A(also other scenarios), the predictions are all negative now, any idea on why and how to fix it? Seems like some bias problem.
b). For your comment below, could you confirm? I'm not certain, but I think I saw outsample performance improved when I set activation="Tanh" and turned hidden dropout ratios. Maybe I just saw random variations.
>>> 2) You didn't specify activation="TanhWithDropout", so the hidden dropout ratios will be ignored.
c). Is there a way to track the training or validation MSE/error for each epoch?
d). This is a more general question, does deep net model the multiplicative interaction like X1*X2? I think some people said that if you create complicated enough structures, it will. But, is there a better/more intuitive way?
e). For your comment below, comparing scenario A vs C, it seems 50% input dropout actually helped. My guess is since X2 is nonlinear (due to abs(X2) term), maybe it's easier for the h2o to fit nonlinear X2 alone than fitting X1 and X2 together with the currently specified setup, sort of like random forest's idea of randomized input variables.
>>> 3) Not sure why you use 50% input dropout, that removes one of the two inputs for every training point, so you only see either X1 or X2, but never both. This will hardly help to train either, I would imagine, but is a nice test.
Anyway, too much questions for now. But I'm pretty sure that with these improved understandings, I'll be using h2o more often in the future and would definitely recommend to others as well. Thank you for the great work!
Regards,
John
-- a few scenarios, each scenario has a few runs with same parameter setup
hidden R2.out R2.in
A). --with reproducible=TRUE and input_dropout_ratio = c(0.5), activation="Tanh",
40,40 0.009439 0.005562
40,40 0.008917 0.00584
40,40 0.009044 0.005801
40,40 0.008925 0.005835
40,40 0.009436 0.005458
note: predictions are all negative(sometimes all positive, but less often)
B). --with reproducible=TRUE and input_dropout_ratio = c(0.5), activation="TanhWithDropout"(hidden drop ratios set to 0.5)
40,40 0.007178 0.005527
40,40 0.008892 0.005651
40,40 0.008891 0.00544
40,40 0.008451 0.005037
40,40 0.009152 0.005001
C). --with reproducible=TRUE and no input_dropout_ratio
40,40 0.005201 0.004876
40,40 0.004469 0.004405
40,40 0.008115 0.00585
D). --with reproducible=FALSE and input_dropout_ratio = c(0.5) ( activation="Tanh")
40,40 0.007818 0.007129
40,40 9.161e-05 0.0002582
40,40 0.007059 0.005604
OLS(2 xs) 0.0087 0.006
OLS(3 xs) 0.0098 0.0063
## -- modified call to h2o according to Arno, Scenario A
model <- h2o.deeplearning(x=c(2:3), # x is 2dn snd 3rd columns
y=4, # y is 4th column, un-scaled
data=train_h2o,
classification = FALSE,
hidden=c(40,40),
epochs=100,
rate=0.05,
y=4, # y is 4th column, un-scaled
data=train_h2o,
classification = FALSE,
hidden=c(40,40),
epochs=100,
activation="Tanh",
adaptive_rate=FALSE,
reproducible=TRUE,
#seed=71,force_load_balance=FALSE,
input_dropout_ratio = c(0.5), # % of inputs dropout
#hidden_dropout_ratios = c(0.5,0.5), # % for nodes dropout
Arno Candel
Apr 23, 2015, 12:53:52 PM4/23/15
to johnwa...@gmail.com, h2os...@googlegroups.com
Hi John,
You are welcome. See answers inline.
On Apr 23, 2015, at 9:15 AM, johnwa...@gmail.com wrote:Hi Arno,
Many thanks for your prompt reply!
Following your suggestions, I did a few runs(just to have a sense of variations if I don't set a random seed) for each of 4 scenarios, and the results are shown below.
I think scenario A is best, even slightly beating OLS or deepnet (B is slightly worse than A when adding hidden dropout regularization).
For A, it does look that specifying a rate=0.1 or 0.05 and also setting reproducible=TRUE helped a lot.
Setting reproducible=FALSE is not too helpful as shown in D in this small example. The distribution of predictions is also much better now.
Still a few more questions:
a). For scenario A(also other scenarios), the predictions are all negative now, any idea on why and how to fix it? Seems like some bias problem.
I wouldn’t expect any bias issues like this, I’ll investigate. Did you do enough repetitions to see consistency?
b). For your comment below, could you confirm? I'm not certain, but I think I saw outsample performance improved when I set activation="Tanh" and turned hidden dropout ratios. Maybe I just saw random variations.2) You didn't specify activation="TanhWithDropout", so the hidden dropout ratios will be ignored.
Yes, without “…WithDropout” activation functions, hidden_dropout_ratios is ignored. Must be a random variation.
c). Is there a way to track the training or validation MSE/error for each epoch?
Yes, set train_samples_per_iteration to 0 or -1 (results in 1 epoch per iteration), then score_duty_cycle=1.0 and score_interval=1e-5. Then it will score at every iteration (which is one epoch). Defaults are no more than 10% of runtime for scoring and no more than every 5 seconds. You can also go to http://localhost:54321 to inspect the model visually.
d). This is a more general question, does deep net model the multiplicative interaction like X1*X2? I think some people said that if you create complicated enough structures, it will. But, is there a better/more intuitive way?
yes, it will. more neurons or more layers (better) will help. I’m sure there’s some paper about this :)
e). For your comment below, comparing scenario A vs C, it seems 50% input dropout actually helped. My guess is since X2 is nonlinear (due to abs(X2) term), maybe it's easier for the h2o to fit nonlinear X2 alone than fitting X1 and X2 together with the currently specified setup, sort of like random forest's idea of randomized input variables.3) Not sure why you use 50% input dropout, that removes one of the two inputs for every training point, so you only see either X1 or X2, but never both. This will hardly help to train either, I would imagine, but is a nice test.
yeah, but 3 repetitions isn’t enough to prove this, I would run each 100 times and average the R^2 to be sure, using the same 100 seeds to have the same initial weights.
Anyway, too much questions for now. But I'm pretty sure that with these improved understandings, I'll be using h2o more often in the future and would definitely recommend to others as well. Thank you for the great work!
You are welcome! Please let me know if you have other questions.
Also, make sure to check out:
Cheers,
Arno
--
You received this message because you are subscribed to a topic in the Google Groups "H2O & Open Source Scalable Machine Learning - h2ostream" group.
To unsubscribe from this topic, visit https://groups.google.com/d/topic/h2ostream/PKXrw4WbhGU/unsubscribe.
To unsubscribe from this group and all its topics, send an email to h2ostream+...@googlegroups.com.
For more options, visit https://groups.google.com/d/optout.
johnwa...@gmail.com
Apr 23, 2015, 2:08:44 PM4/23/15
to h2os...@googlegroups.com, johnwa...@gmail.com
> Still a few more questions:
> a). For scenario A(also other scenarios), the predictions are all negative now, any idea on why and how to fix it? Seems like some bias problem.
>>>I wouldn’t expect any bias issues like this, I’ll investigate. Did you do enough repetitions to see consistency?
Thanks Arno. I did see this bias issue almost for all runs (a dozen runs at the least), it seemed to have started after I set adaptive_rate=FALSE.
> a). For scenario A(also other scenarios), the predictions are all negative now, any idea on why and how to fix it? Seems like some bias problem.
>>>I wouldn’t expect any bias issues like this, I’ll investigate. Did you do enough repetitions to see consistency?
I appreciate your other comments and pointers.
Thanks,
John
Arno Candel
Apr 23, 2015, 7:19:07 PM4/23/15
to johnwa...@gmail.com, h2os...@googlegroups.com
John,
Adding some L1 or L2 penalty seems to make the predictions centered around 0 with either adaptive rate or not. Note that 10 epochs are plenty, even 1 epoch is fine.
model <- h2o.deeplearning(x=c(2:3), # x is 2dn snd 3rd columns
y=4, # y is 4th column, un-scaled
training_frame=train_h2o,
hidden=c(40,40),
epochs=10,
l2=1e-3, <— this helps
reproducible=F,
rate=0.1,
adaptive_rate=F,
activation="Tanh",
)
It seems that reproducible=T makes it a little more negative on average, not sure why. I’ll keep looking for something systematic.
Thanks again!
Arno
Adding some L1 or L2 penalty seems to make the predictions centered around 0 with either adaptive rate or not. Note that 10 epochs are plenty, even 1 epoch is fine.
model <- h2o.deeplearning(x=c(2:3), # x is 2dn snd 3rd columns
y=4, # y is 4th column, un-scaled
hidden=c(40,40),
epochs=10,
l2=1e-3, <— this helps
reproducible=F,
rate=0.1,
adaptive_rate=F,
activation="Tanh",
input_dropout_ratio = c(0.5), # % of inputs dropout
train_samples_per_iteration = -1,
)
It seems that reproducible=T makes it a little more negative on average, not sure why. I’ll keep looking for something systematic.
Thanks again!
Arno
johnwa...@gmail.com
Apr 23, 2015, 9:58:20 PM4/23/15
to h2os...@googlegroups.com, johnwa...@gmail.com
Hi Arno,
I tried to add in l2=1e-3 (also changed epoch to 10) and ran a few times, but it didn't seem to work for me, still quite negative predictions.
Strange, I wonder if it's my R h2o version(I installed from CRAN directly) vs your h2o_dev difference.
There's a lot of online discussions on sigmoid vs tanh, in particular,
one paper by Bengio referred below mentioned tanh's strange saturation with certain initialization scheme in part 3.1 and 3.2). I don't have the knowledge to say if it's related to bias, just something I found.
Thanks for you time,
John
http://www.reddit.com/r/MachineLearning/comments/1jj9y0/why_dont_sigmoid_and_tanh_neural_nets_behave/
http://machinelearning.wustl.edu/mlpapers/paper_files/AISTATS2010_GlorotB10.pdf
Arno Candel
Apr 24, 2015, 3:45:23 PM4/24/15
to johnwa...@gmail.com, h2os...@googlegroups.com
John,
Thanks. It might have to do with the bias value initialization. The thing is that you can always find an academic synthetic test case that causes such issues.
Here’s a paper that looks at “good” unit tests for this kind of problem: http://arxiv.org/pdf/1312.6055v3.pdf, and a thorough study should probably compare algos across many such datasets.
Cheers,
Arno
johnwa...@gmail.com
Apr 24, 2015, 9:29:23 PM4/24/15
to h2os...@googlegroups.com, johnwa...@gmail.com
Ok, Arno, thanks for your time. For now, a temporary solution for me may be to rescale the h2o prediction mean/std to a known prediction like OLS.
Regards, John
Regards, John

KC Tung
Feb 15, 2017, 11:51:40 PM2/15/17
to H2O Open Source Scalable Machine Learning - h2ostream, johnwa...@gmail.com
Hi Arno,
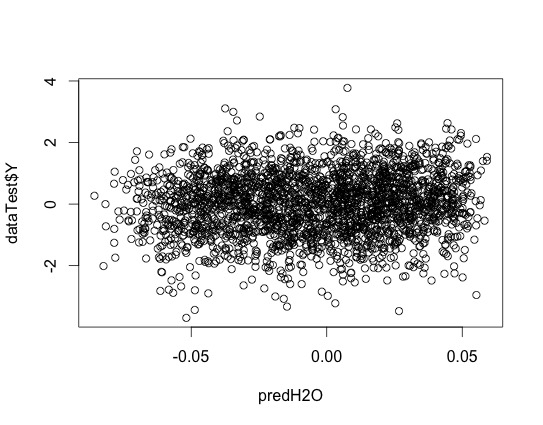
I find this example very useful. However, I struggle to make deep learning work for regression problem such as this one proposed by this thread's originator. I took his original R code and had to do some tweaking in the h2o.deeplearning(). I expect the scatter plot plot(predH2O,dataTest$Y) should show a linear relationship between prediction and ground truth. However it is nothing like it. This seemed to be a simple problem but I tried different hyperparameters such as L1, L2 regularization, drop out, number of neurons..etc. Nothing worked. So your advice is deeply appreciated.
y<-"Y"
x<-setdiff(names(dataTrain), y);
train_h2o<-as.h2o(dataTrain)
test_h2o<-as.h2o(dataTest)
#h2o deep net
model <- h2o.deeplearning(x=c(2,3), # x is 2dn and 3rd columns
y=c(4), # y is 4th column, un-scaled
training_frame=train_h2o,
hidden=c(40,40),
epochs=100,
activation="TanhWithDropout",
adaptive_rate=TRUE,
input_dropout_ratio = c(0.1), # % of inputs dropout
hidden_dropout_ratios = c(0.1,0.1), # % for nodes dropout
train_samples_per_iteration = -1, # use all data, not sampled
classification_stop = -1,
l1 = 1e-5,
l2=1e-3
)
## outsample
## Converting H2O format into data frame
df_yhat_test <- as.data.frame(h2o.predict(model, test_h2o) )
predH2O<- df_yhat_test$predict
plot(predH2O,dataTest$Y)
ph...@0xdata.com
Feb 16, 2017, 1:39:09 PM2/16/17
to H2O Open Source Scalable Machine Learning - h2ostream, johnwa...@gmail.com
Have you tried a lower number of neurons? like 10-15, and just a single layer, tanh activations, with very little regularization?
I know this seems like a silly, simple answer but the reason I suggest it is because the very complex sample data sets described in this fairly well-known paper:
http://www.stat.ucla.edu/~cocteau/stat204/readings/spatialadapt.pdf
can usually be fit exactly by 1-layer, feed forward MLPs with just a few neurons if they are not overtrained.
Good luck.
p
Reply all
Reply to author
Forward
0 new messages